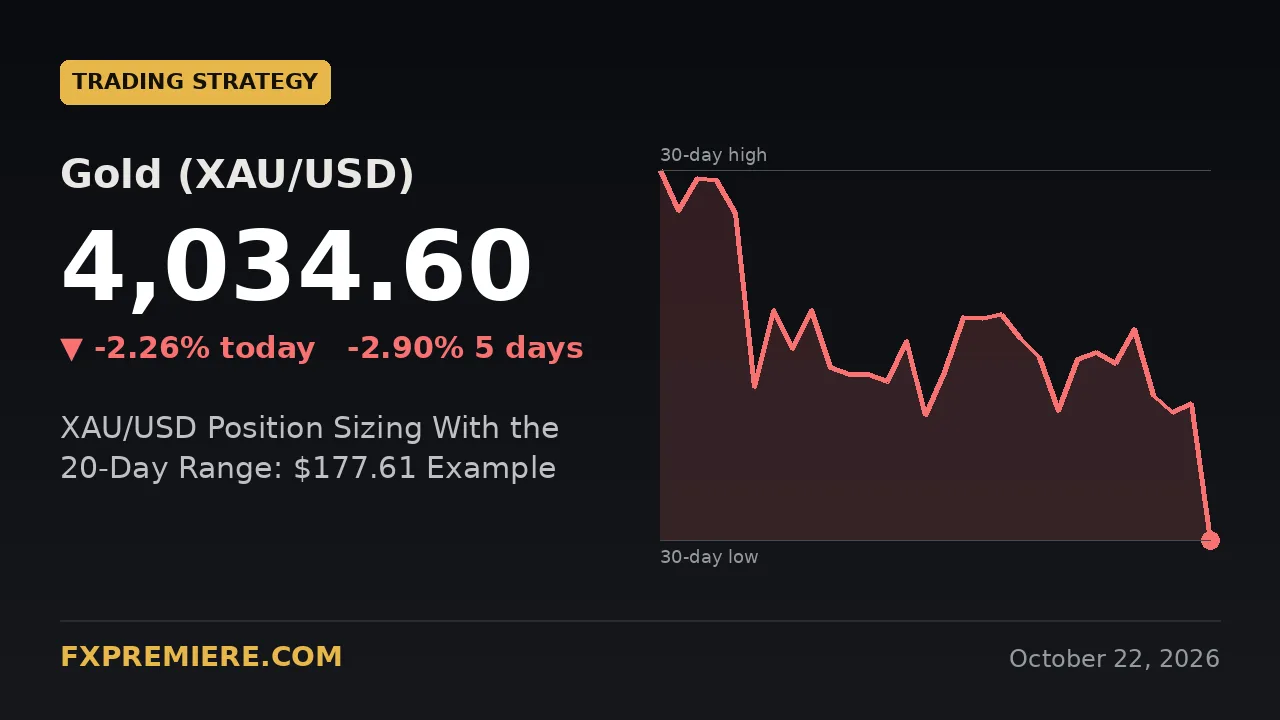
Gold trades at 4,132.8 after a 1.47% rise, and its 20-day range of 363.0 points (3,879.3 to 4,242.3) is a practical ruler for sizing risk. Price sits about 70% of the way up that range, 109.5 points below the 20-day high and 253.5 above the low. This article walks through how to turn those numbers into a stop distance and a position size.
Key figures
| Instrument | Last | Daily change | 20-day high | 20-day low | 20-day average |
|---|---|---|---|---|---|
| Gold (XAU/USD) | 4,132.8 | +59.8 (+1.47%) | 4,242.3 | 3,879.3 | 4,088.75 |
| EUR/USD | 1.1244 | +0.00368 (+0.33%) | 1.12752 | 1.11095 | 1.11987 |
| US Dollar Index (DXY) | 101.404 | -0.106 (-0.1%) | 102.95 | 101.1 | 101.96 |
What is the 20-day range and why use it to size a trade?
The 20-day range is the distance between the highest and lowest prices of the last 20 daily sessions, and it shows how far an instrument has recently been willing to travel.
That matters because a stop-loss that is much tighter than normal movement tends to be hit by noise, while one that is far wider than needed means a very small position to keep risk fixed. The range gives you a sense of scale before you decide anything.
The method has three steps:
- Measure the range (high minus low).
- Note where price sits inside it.
- Choose a stop distance in relation to that range, then size the position so a stop-out costs a fixed amount.
Where is gold inside its 20-day range today?
Gold is at 4,132.8, which is 69.8% of the way from the 20-day low to the 20-day high.
The arithmetic, using only today's figures:
- Range: 4,242.3 minus 3,879.3 = 363.0 points, about 8.8% of the current price.
- Above the low: 4,132.8 minus 3,879.3 = 253.5 points.
- Below the high: 4,242.3 minus 4,132.8 = 109.5 points.
- Above the 20-day average: 4,132.8 minus 4,088.75 = 44.05 points.
Gold has also risen 2.52% over the week. Today's range so far is 4,067.0 to 4,155.8, or 88.8 points, which is about a quarter (24.5%) of the whole 20-day range in a single session. That tells you the market is moving at a fast pace, and risk that felt comfortable on a quiet day may be too large now.
How do you turn the range into a stop distance and position size?
Fix the amount you are willing to lose first, then divide it by the stop distance to get the size.
The example below is purely hypothetical: a 10,000 account risking 1% per trade, so 100 at risk. It assumes one lot is 100 ounces, which is common but should be checked with your own broker.
Step 1: pick a stop distance with a reason
Three reference distances come straight from today's data:
- 36.3 points (10% of the 20-day range): a tight stop, more exposed to normal noise.
- 88.8 points (today's range so far): a stop that allows for a full day of movement.
- 109.5 points (the gap to the 20-day high): a stop sized to a full move back to the recent peak.
Step 2: divide risk by distance
- 100 / 36.3 = about 2.75 ounces, roughly 0.0275 lots.
- 100 / 88.8 = about 1.13 ounces, roughly 0.011 lots.
- 100 / 109.5 = about 0.91 ounces, roughly 0.009 lots.
The pattern is clear: the wider the stop, the smaller the position, but the money at risk stays the same. A trader who keeps the same position size whatever the stop distance is changing their risk without noticing.
Step 3: check the stop sits somewhere meaningful
A stop distance chosen by arithmetic alone can land in the middle of nowhere. Compare it with the levels in the data. The 20-day average at 4,088.75 and the day low at 4,067.0 are structural reference points. The 20-day low at 3,879.3 is far below, so a stop placed there would be a very wide one. For more on this part, see our guide to free trading lessons in the Trading Academy.
How does the same method look on EUR/USD?
EUR/USD has a 20-day range of 165.7 pips (1.11095 to 1.12752), and at 1.1244 it sits about 81% of the way up it.
- Price is 134.5 pips above the low and only 31.2 pips below the 20-day high.
- It is 45.3 pips above the 20-day average of 1.11987.
- The day's range so far is 39.2 pips (1.12322 to 1.12714), after a 36.8-pip rise.
Using the same 100 risk: a 20-pip stop at about 10 per pip per standard lot means 0.5 lots. A stop equal to today's 39.2-pip range means about 2.55 per pip, roughly 0.25 lots. Pip values depend on account currency and contract, so verify yours. If pairs and pip values are new to you, read currency pairs explained first.
What does the dollar index add to the picture?
The US Dollar Index at 101.404 is only 0.304 above its 20-day low of 101.1, so the dollar is near the weak end of its recent range.
Its 20-day range is 1.85 points (101.1 to 102.95), and price sits about 16% of the way up it. A softer dollar has coincided with gains in both gold and EUR/USD today, which matters for risk: the two positions may not be independent. If you hold both, a dollar reversal could hurt both at once, so treat them as partly the same bet when counting total risk. A close back above the 20-day average of 101.96 would show the dollar recovering ground.
Which events could stretch today's range?
The Bank of England decision at 12:00 UTC is the main scheduled risk today, with Friday's US jobs data following. All times are UTC.
- Thu 12:00: GBP Official Bank Rate, forecast 4.00%, previous 3.75%. MPC votes forecast 7-0-2, previous 3-0-6. The Monetary Policy Summary and Monetary Policy Report are released at the same time.
- Thu 12:30: BOE Governor Bailey speaks.
- Thu 13:30: USD Unemployment Claims, forecast 197K, previous 194K.
- Thu 18:00: ECB President Lagarde speaks.
- Fri 13:30: USD Non-Farm Employment Change, forecast 65K, previous 29K; Unemployment Rate, forecast 4.2%, previous 4.2%; Average Hourly Earnings m/m, forecast 0.3%, previous 0.1%.
The sizing lesson is simple. Gold has already moved 88.8 points this session, and these releases can widen it. A trader who sized for a 36.3-point stop may find it hit by a single headline, while one who sized for a wider stop at least knows the loss is capped at the planned amount. Some traders choose to stay out until the event passes. Neither is right for everyone.
Frequently asked questions
How much of my account should I risk per trade?
Many traders keep risk to between 0.5% and 2% of the account per trade, and the 1% used above is only an example. The right figure depends on your account size, experience and how many positions you hold at once.
Is a wider stop always safer?
No. A wider stop reduces the chance of being stopped out by noise, but it needs a smaller position to keep the same money at risk. If you keep the position size unchanged, a wider stop simply makes each loss larger.
Does the 20-day range change?
Yes, it updates every day as old sessions drop out and new ones are added. A new high or low expands it, so recalculate before each trade rather than reusing a figure from last week.
How traders can use this
- Measure first. Write down the 20-day range for the instrument (363.0 points for gold today) and the day's range so far (88.8 points).
- Fix the money, then the size. Decide the amount at risk, divide by your stop distance, and round the position down, not up.
- Name the level that changes the picture. For gold, a daily close above the 20-day high of 4,242.3 would extend the range, while a move back below the 20-day average of 4,088.75 would put price under its recent midpoint.
- Check the calendar and correlation. Look at the 12:00 UTC Bank of England decision and Friday's 13:30 UTC jobs data, and remember gold and EUR/USD are both leaning on a weaker dollar.
You can see how range-based thinking appears in live setups on our gold signals page, and compare past outcomes in the 2026 gold signal results. More articles like this are in Forex Signals Strategies.
Trading involves risk, and you can lose more than you expect, especially around high-impact news. The levels and examples here are for education only and are not financial advice.
Before you join a gold channel, read trader reviews on telegramsignalslive.com.
Risk warning: trading gold, forex, CFDs, indices and crypto involves significant risk of loss. Signals are educational information, not personal financial advice, and past results do not guarantee future performance. FXPremiere is a signal provider, not a broker.