

How to Use Pivot Points to Trade Breakouts
April 20, 2023
Japanese Candlesticks
May 3, 2023
Daily FX Signals – How to Trade Wedge Chart Patterns
In a Wedge chart pattern, two trend lines converge.

Wedges signal a pause in the current trend.
When you encounter this formation, it signals that forex traders are still deciding where to take the pair next.
A Falling Wedge is a bullish chart pattern that takes place in an upward trend, and the lines slope down.
A Rising Wedge is a bearish chart pattern that’s found in a downward trend, and the lines slope up.
Wedges can serve as either continuation or reversal patterns.
Rising Wedge
A rising wedge is formed when the price consolidates between upward sloping support and resistance lines.
Here, the slope of the support line is steeper than that of the resistance.
This indicates that higher lows are being formed faster than higher highs. This leads to a wedge-like formation, which is exactly where the chart pattern gets its name from!
With prices consolidating, we know that a big splash is coming, so we can expect a breakout to either the top or bottom.
If the rising wedge forms after an uptrend, it’s usually a bearish reversal pattern.
On the other hand, if it forms during a downtrend, it could signal a continuation of the down move.
Either way, the important thing is that, when you spot this forex trading chart pattern, you’re ready with your entry orders!
Rising Wedge Chart Pattern
In this first example, a rising wedge formed at the end of an uptrend.
Notice how price action is forming new highs, but at a much slower pace than when price makes higher lows.
Trading Chart Pattern: Rising Wedge After
See how price broke down to the downside? That means there are more forex traders desperate to be short than be long!
They pushed the price down to break the trend line, indicating that a downtrend may be in the cards.
Just like in the other forex trading chart patterns we discussed earlier, the price movement after the breakout is approximately the same magnitude as the height of the formation.
Now let’s take a look at another example of a rising wedge formation. Only this time it acts as a bearish continuation signal.
Rising Wedge Chart Pattern Bearish Example
As you can see, the price came from a downtrend before consolidating and sketching higher highs and even higher lows.
Rising Wedge Continuation Chart Pattern
In this case, the price broke to the downside and the downtrend continued. That’s why it’s called a continuation signal yo!
See how the price made a nice move down that’s the same height as the wedge?
What did we learn so far about these Japanese candlestick chart patterns?
A rising wedge formed after an uptrend usually leads to a REVERSAL (downtrend) while a rising wedge formed during a downtrend typically results in a CONTINUATION (downtrend).
Simply put, a rising wedge leads to a downtrend, which means that it’s a bearish chart pattern!
Falling Wedge
Just like the rising wedge, the falling wedge can either be a reversal or continuation signal.
As a reversal signal, it is formed at a bottom of a downtrend, indicating that an uptrend would come next.
As a continuation signal, it is formed during an uptrend, implying that the upward price action would resume. Unlike the rising wedge, the falling wedge is a bullish chart pattern.
Falling Wedge Chart Pattern
In this example, the falling wedge serves as a reversal signal. After a downtrend, the price made lower highs and lower lows.
Notice how the falling trend line connecting the highs is steeper than the trend line connecting the lows.
Falling Wedge Breakout Forex Chart Pattern
Upon breaking above the top of the wedge, the pair made a nice move upwards that’s approximately equal to the height of the formation. In this case, the price rally went a few more pips beyond that target!
3 Main Groups of Chart Patterns
Let’s take a look at an example where the falling wedge serves as a continuation signal.
Like we mentioned earlier, when the falling wedge forms during an uptrend, it usually signals that the trend will resume later on.
How to Trade Wedge Chart Patterns
In this case, the price consolidated for a bit after a strong rally. This could mean that buyers simply paused to catch their breath and probably recruited more people to join the bull camp.
Hmm, it looks like the pair is revving up for a strong move. Which way would it go?
Falling Wedge Continuation Forex Chart Pattern
See how the price broke to the top side and went on to climb higher?
If we placed an entry order above that falling trend line connecting the pair’s highs, we would’ve been able to jump in on the strong uptrend and caught some pips!
A good upside target would be the height of the wedge formation.
Daily FX Signals – How to Trade Wedge Chart Patterns
Asia FX dips, dollar steadies as Fed uncertainty mounts


Aussie tumbles after RBA pauses rate hikes, dollar rebounds
Daily FX Signals – How to Trade Wedge Chart Patterns
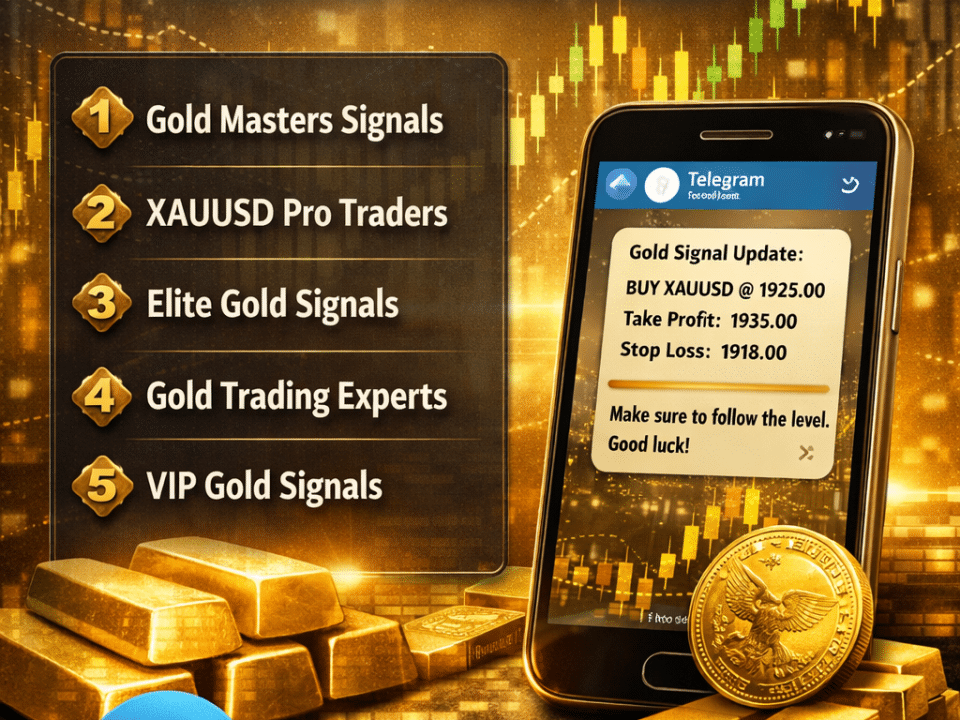
🔗 For reliable GOLD signals, visit GoldSignals.co.
Latest Market Updates
Fully Managed Fund Copier Service Now LaunchedSignals, News and Research Forecast for FX, Gold, US30, Nasdaq and Crypto Starting 20th – 25th April 2026
Are There Any Recommended Telegram Channels for Crypto Trading Signals?
What Factors Should I Consider When Choosing a Forex Signal Provider?What Factors Should I Consider When Choosing a Forex Signal Provider?
How Can I Find Reliable Signals for US30 and NAS100 Trading?
What Are the Best Strategies for Trading XAUUSD Effectively?
Crypto Signals News Forecast Starting 17th April 2026
Indice Signals News Forecast Starting 17th April 2026
Gold XAUUSD Signals News Forecast Starting 17th April 2026
Forex Signals News Forecast Starting 17th April 2026
