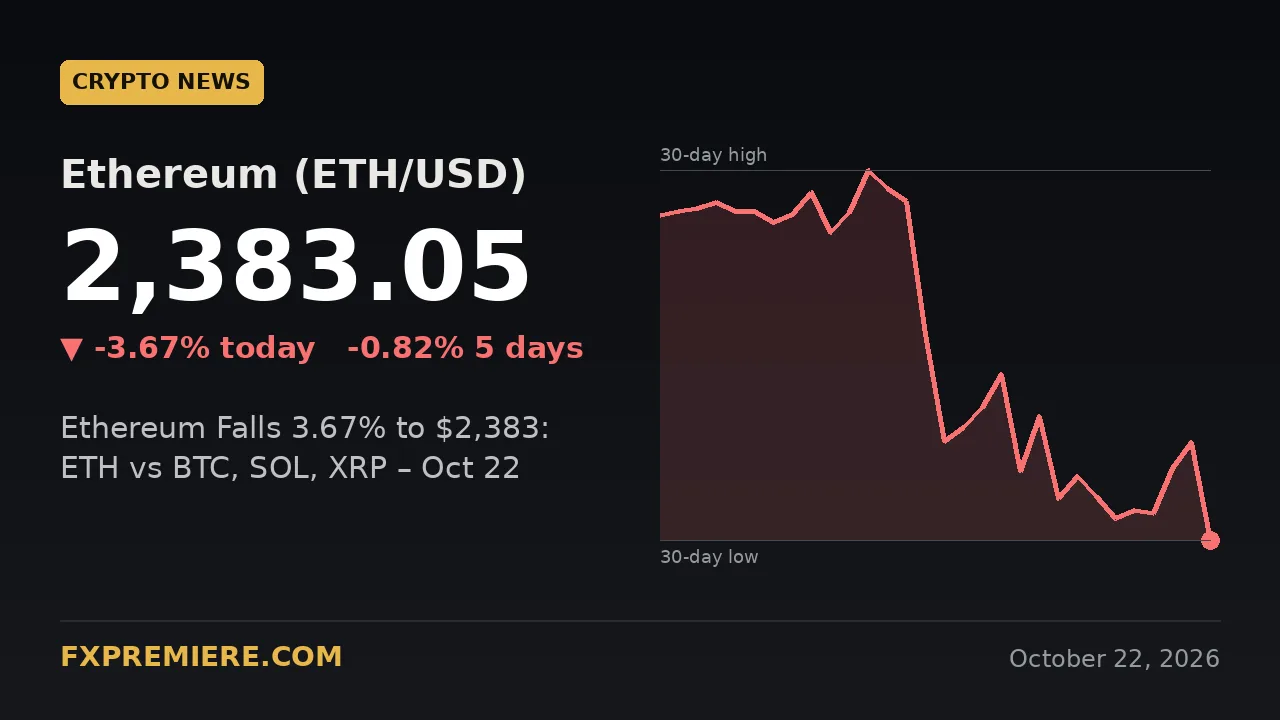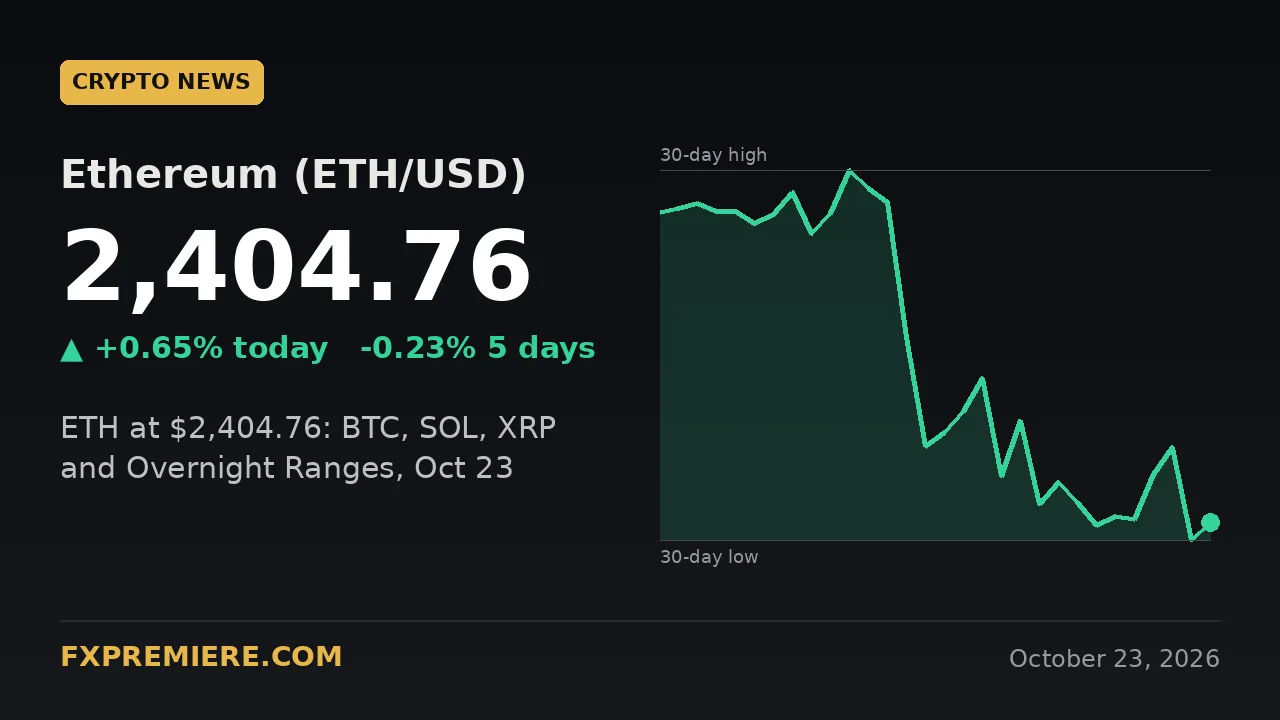
Ethereum is trading at $2,404.76 at 18:05 UTC on Friday, up $15.62 or 0.65% on the day, which makes it a little stronger than Bitcoin (+0.14%) this evening. ETH is still $89.48 below its 20-day average of $2,494.24 and only $86.76 above its 20-day low of $2,318, so the overnight question is whether it can hold the lower part of its range.
Key figures
| Instrument | Last | Daily change | 20-day high | 20-day low | 20-day average |
|---|---|---|---|---|---|
| Ethereum (ETH/USD) | 2,404.76 | +15.62 (+0.65%) | 2,739.50 | 2,318.00 | 2,494.24 |
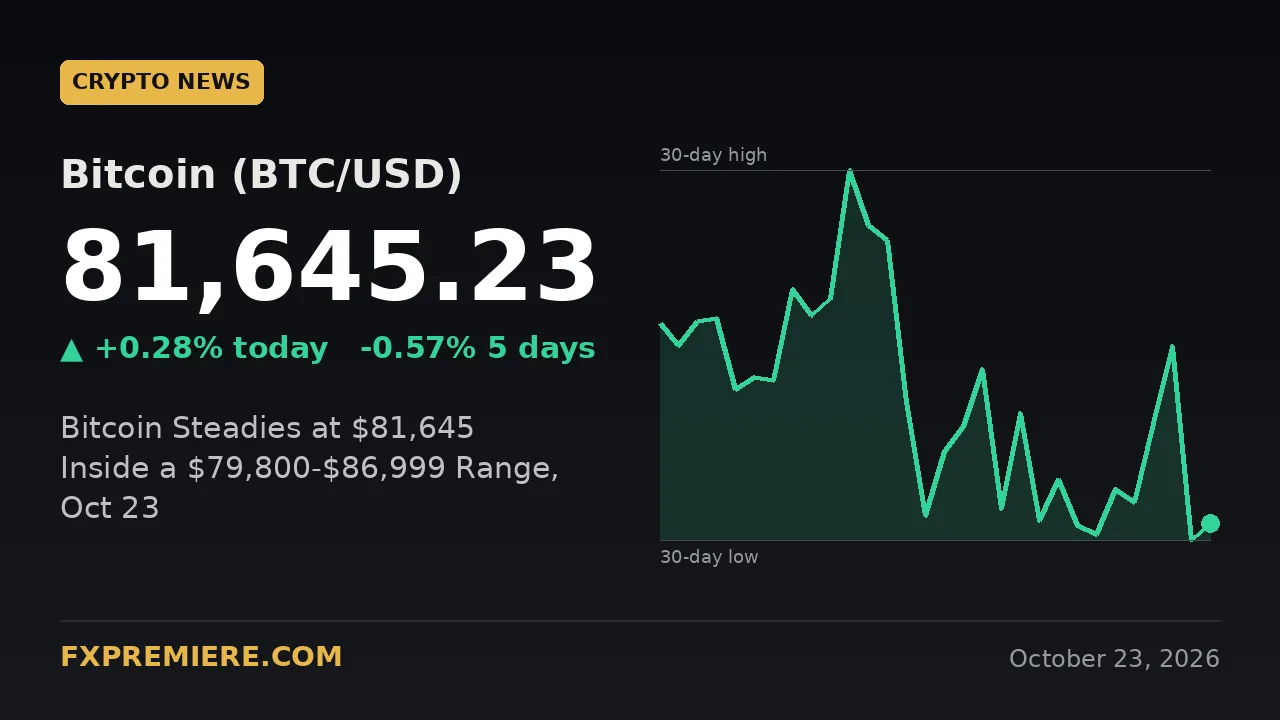
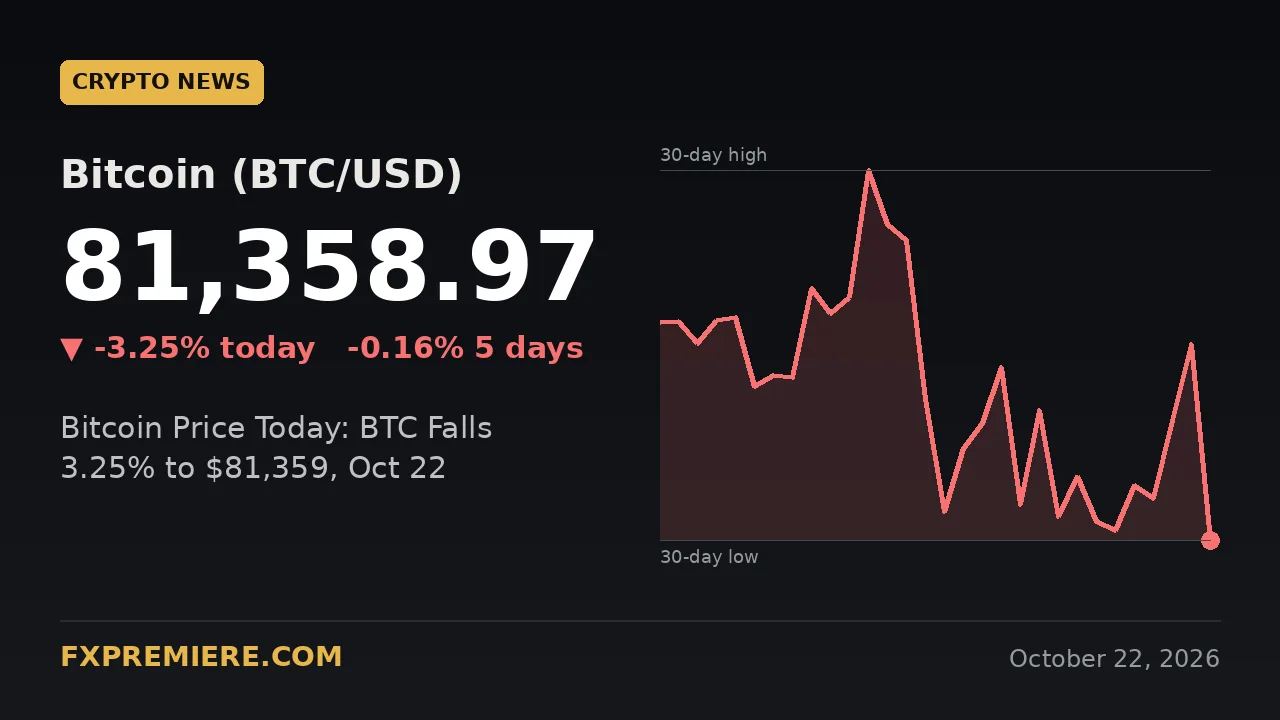
| Bitcoin (BTC/USD) | 81,529.15 | +113.06 (+0.14%) | 86,999.11 | 79,800.00 | 82,924.75 |
| Solana (SOL/USD) | 104.30 | +0.65 (+0.63%) | 122.29 | 100.43 | 109.023 |
| XRP (XRP/USD) | 1.3088 | -0.0006 (-0.05%) | 1.531 | 1.2562 | 1.3723 |
How is Ethereum trading this evening?
Ethereum is modestly higher, at $2,404.76 against a previous close of $2,389.14, and it has traded between $2,378.51 and $2,417.77 today.
That is a daily range of $39.26, with the last price about $26.25 above the low and $13.01 below the high. Over the past week ETH is down 0.23%, so today's gain has mostly offset earlier weakness rather than started a new trend.
The wider picture is more cautious. ETH sits in the lower fifth of its 20-day range ($2,318 to $2,739.50), well below the $2,494.24 average. Buyers have defended the bottom of that band so far, but the price has not yet recovered the middle of it.
How is ETH performing against Bitcoin?
ETH is outperforming Bitcoin on the day, +0.65% against +0.14%, which lifts the ETH/BTC ratio to roughly 0.0295 from about 0.0293 at yesterday's close.
Over the week the gap runs the same way: ETH is down 0.23% while BTC is down 0.71%. It is a small difference, but it shows Ether holding up slightly better than the market's largest coin.
Bitcoin itself is at $81,529.15, between a 20-day low of $79,800 and a high of $86,999.11. It is $1,729.15 above the low and $1,395.60 below the 20-day average of $82,924.75. Today's range ran from $81,099 to $82,060.88. A move above that day high would put the average back in view, while a slip under $81,099 would bring the $79,800 floor closer. More background on trading crypto alongside other markets is in our guide to building a multi-market portfolio.
What are Solana and XRP doing today?
Solana is edging higher while XRP is flat, so the altcoin picture is mixed and quiet rather than directional.
Solana (SOL/USD)
- Last: $104.30, up 0.63% on the day and 0.18% on the week.
- Day range: $103.46 to $105.24.
- 20-day context: $3.87 above the low of $100.43, and $4.72 below the average of $109.023. The 20-day high is $122.29.
XRP (XRP/USD)
- Last: $1.3088, down 0.05% on the day and up 0.13% on the week.
- Day range: $1.3025 to $1.3307.
- 20-day context: $0.0526 above the low of $1.2562, and $0.0635 below the average of $1.3723. The 20-day high is $1.531.
XRP pushed up to $1.3307 at one point today but has given most of that back, which suggests sellers are still active on rallies. Solana is the closer of the two to its own 20-day low in percentage terms, at about 3.9% above it, against about 4.2% for XRP.
What ranges should traders watch overnight?
The most useful overnight markers are today's highs and lows, with the 20-day lows as the wider line in the sand.
- ETH: $2,417.77 and $2,378.51 frame the day. A sustained move above $2,417.77 would be a step towards the $2,494.24 average. A break below $2,378.51 would put the $2,318 low in focus.
- BTC: $82,060.88 above and $81,099 below. The $79,800 low is the larger level.
- SOL: $105.24 and $103.46 for the day, with $100.43 as the 20-day floor.
- XRP: $1.3307 and $1.3025 for the day, with $1.2562 as the 20-day floor.
Crypto trades around the clock, and weekend liquidity is often thinner than on weekdays, so ranges can break more abruptly. Many traders reduce size or widen their planning for that reason. Our piece on the 1% to 2% risk rule explains one way to keep exposure in proportion, and the same logic applies to crypto.
Which calendar events mattered today?
Today's calendar was dominated by flash PMI surveys and US sentiment data, all of which have already been released by this evening. The figures below show the forecasts and prior readings; actual results are not part of the data used for this article.
- 06:00 UTC, GBP Retail Sales m/m: forecast -0.1%, previous 0.5%.
- 07:15 UTC, French Flash Manufacturing PMI: forecast 50.5, previous 50.3. French Flash Services PMI: forecast 50.7, previous 51.4.
- 07:30 UTC, German Flash Manufacturing PMI: forecast 53.5, previous 53.8. German Flash Services PMI: forecast 52.5, previous 52.9.
- 08:30 UTC, UK Flash Manufacturing PMI: forecast 51.8, previous 52.0. UK Flash Services PMI: forecast 51.8, previous 51.7.
- 13:45 UTC, US Flash Manufacturing PMI: forecast 55.4, previous 57.0. US Flash Services PMI: forecast 57.9, previous 58.7.
- 14:00 UTC, Revised UoM Consumer Sentiment: forecast 46.3, previous 46.3. Revised UoM Inflation Expectations: previous 4.7%.
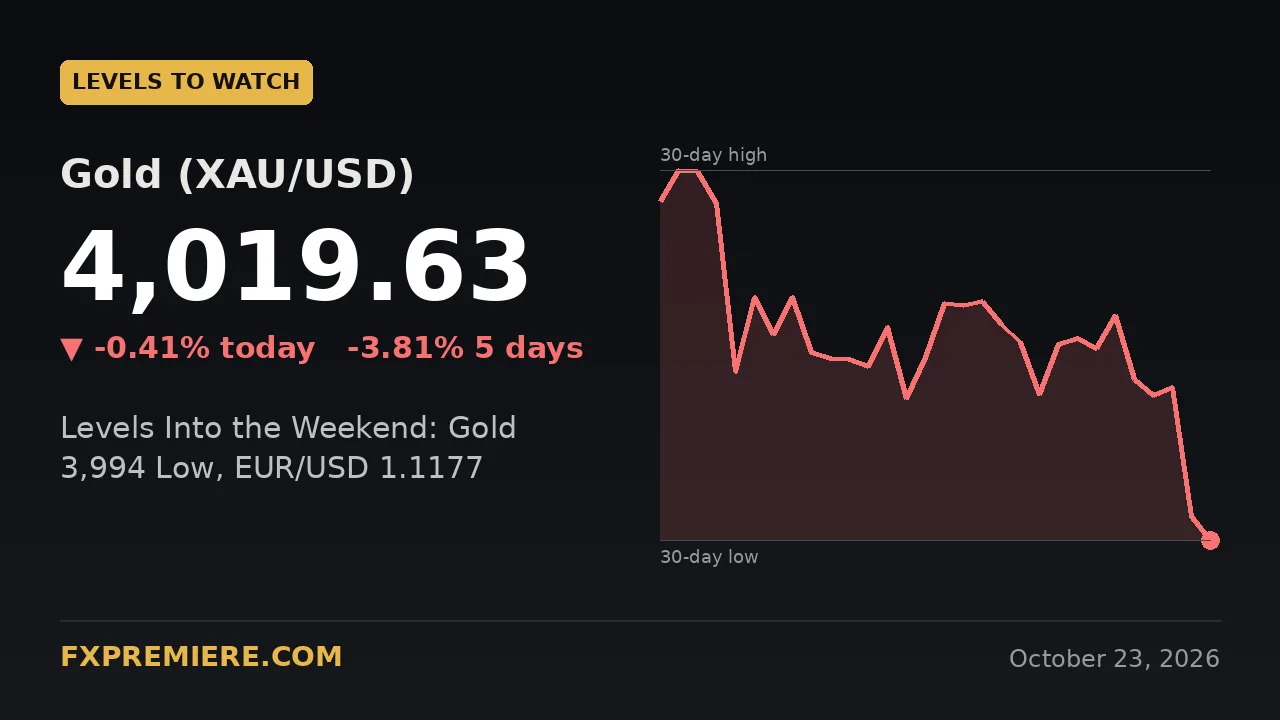
These releases tend to affect crypto indirectly, through the US dollar and expectations for interest rates. No further high or medium impact events are listed for the rest of today, so overnight direction may depend more on positioning and technical levels than on scheduled news. Traders who follow gold alongside crypto can compare the same macro themes on our gold signals page.
Frequently asked questions
What is the Ethereum price today?
Ethereum is trading at $2,404.76 as of 18:05 UTC on 23 October 2026, up 0.65% from the previous close of $2,389.14. Today's range so far is $2,378.51 to $2,417.77.
Is ETH stronger than Bitcoin right now?
On the day, yes: ETH is up 0.65% against 0.14% for BTC, and it is down 0.23% on the week against 0.71% for Bitcoin. The ETH/BTC ratio is roughly 0.0295, a small rise from yesterday's close.
Where are the key support levels for ETH?
The nearest reference is today's low of $2,378.51, followed by the 20-day low of $2,318. On the upside, the 20-day average of $2,494.24 and the 20-day high of $2,739.50 are the wider markers. For ideas on how traders structure crypto trades, see our crypto signals section.
Trading involves risk, and you can lose more than you expect. The levels in this article are for education only and are not financial advice. Always size positions to a loss you can afford.
Risk warning: trading gold, forex, CFDs, indices and crypto involves significant risk of loss. Signals are educational information, not personal financial advice, and past results do not guarantee future performance. FXPremiere is a signal provider, not a broker.