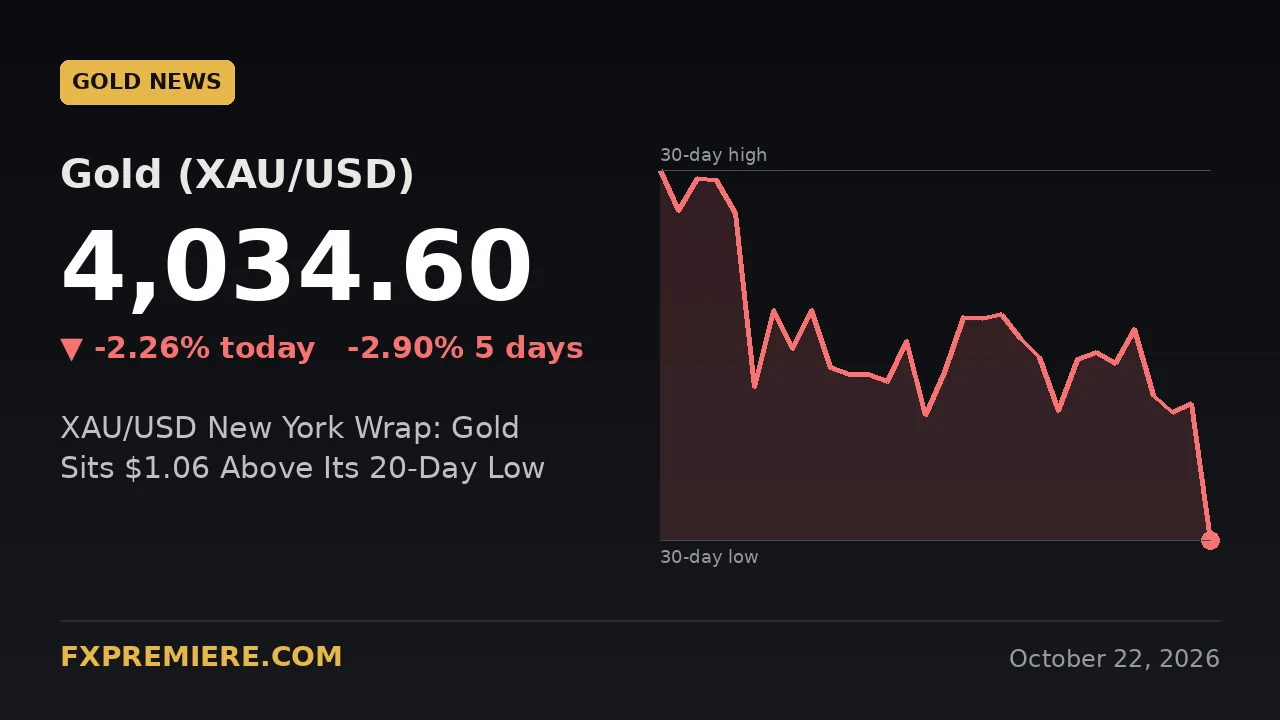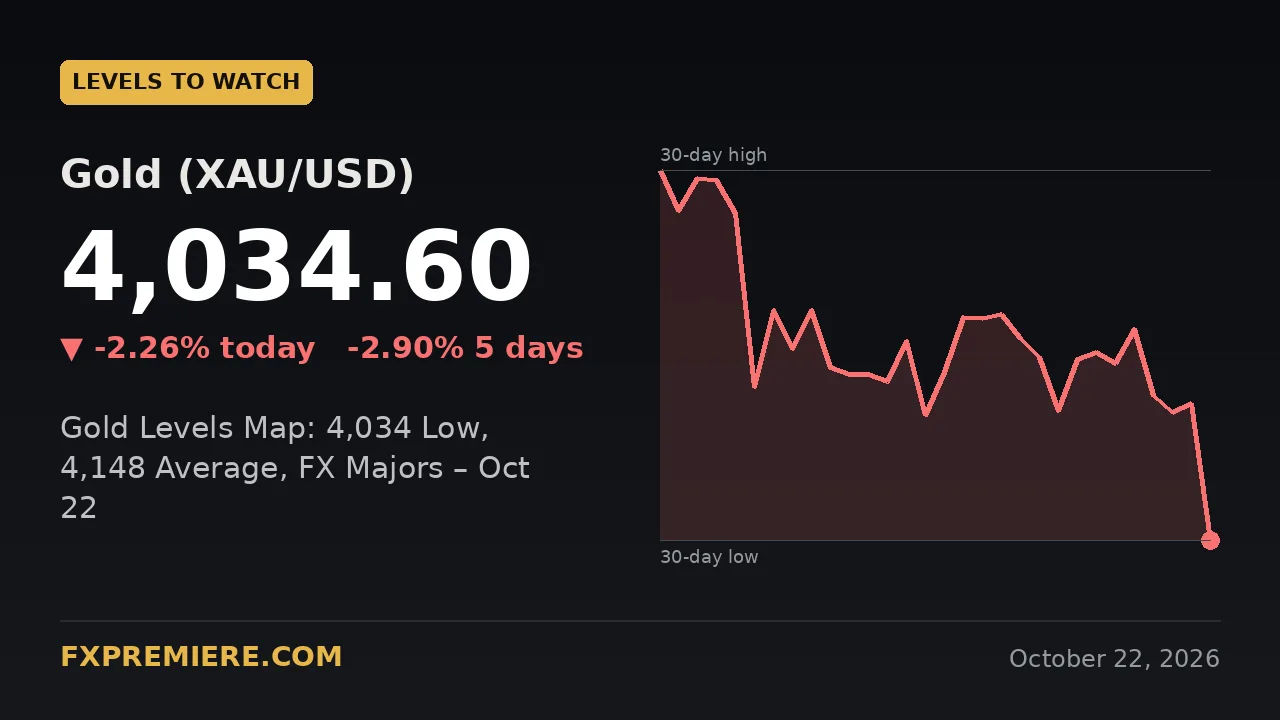
Gold is trading at 4,034.6 after a 2.26% fall on the day, leaving it only $1.06 above its 20-day low of 4,033.54. The 20-day average at 4,148.53 and the 20-day high at 4,211.15 now sit above price, while EUR/USD (1.1205), GBP/USD (1.3376) and USD/JPY (157.05) are all trading close to the edges of their own 20-day ranges.
The main New York session is nearly over, so this map looks at where things stand now and which levels matter going into Friday's cluster of flash PMIs.
Key figures
| Instrument | Last | Daily change | 20-day high | 20-day low | 20-day average |
|---|---|---|---|---|---|
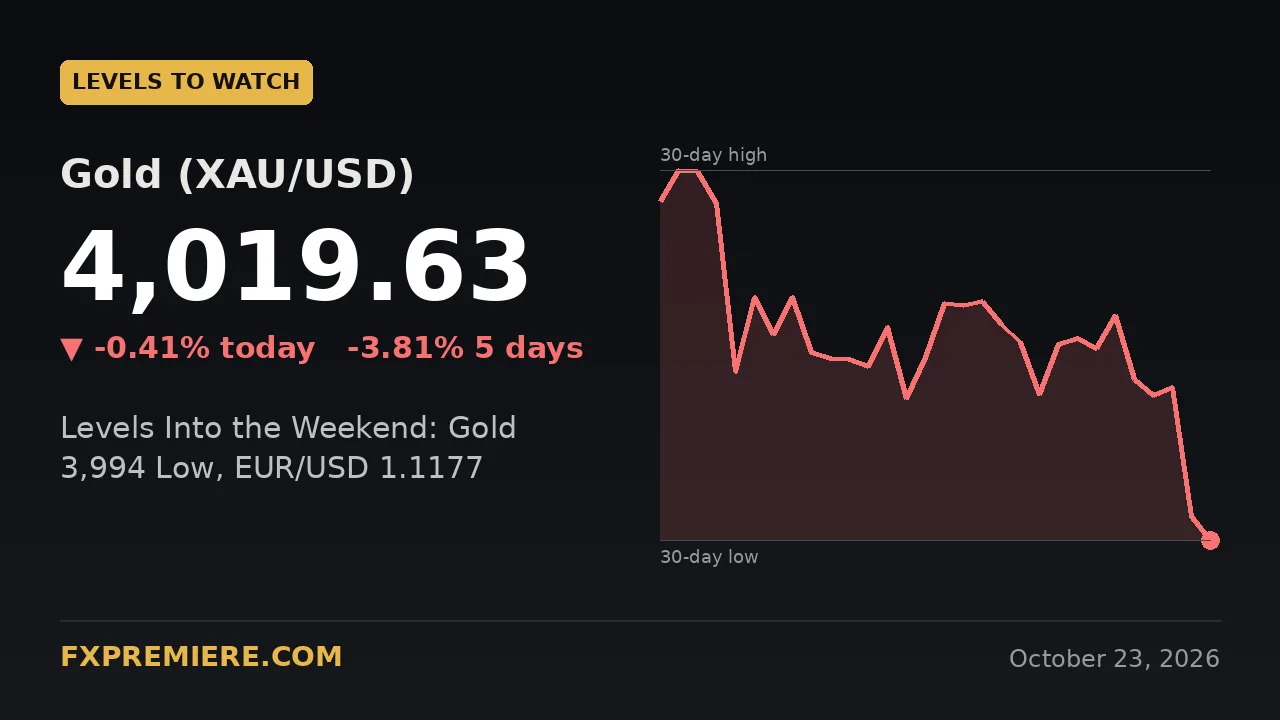
| Gold (XAU/USD) | 4034.6 | -93.44 (-2.26%) | 4211.15 | 4033.54 | 4148.53 |
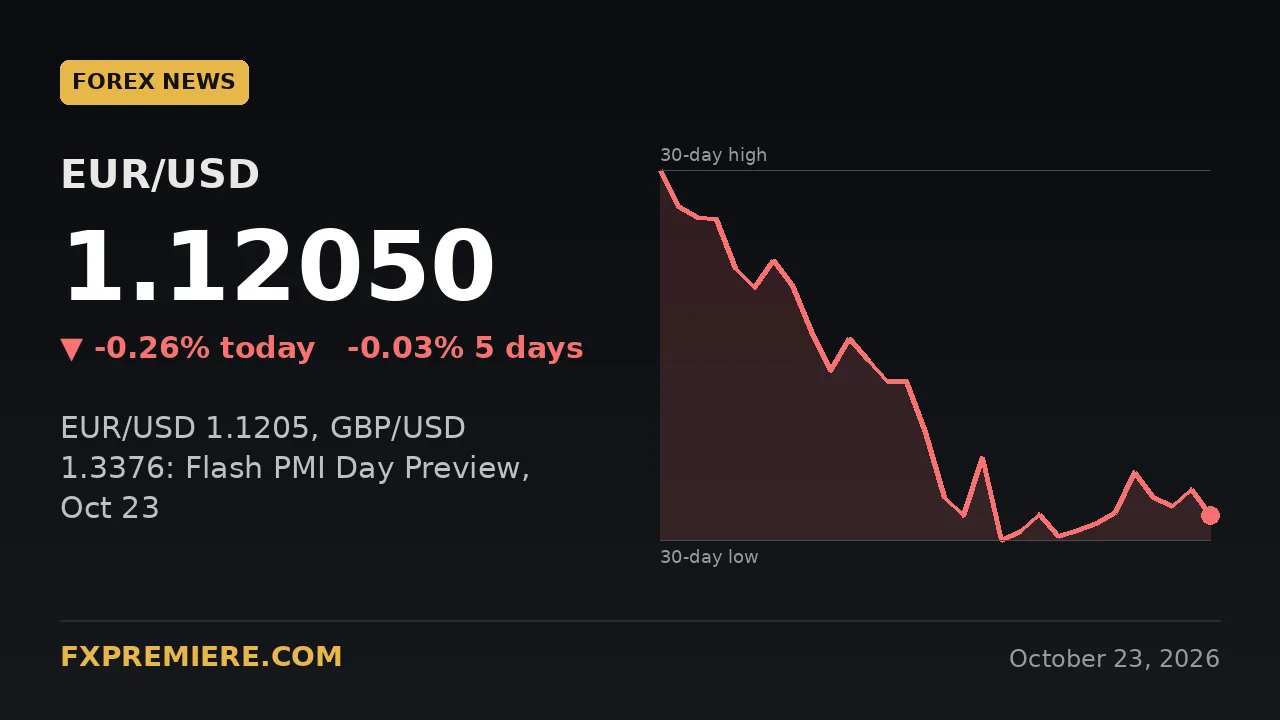
| EUR/USD | 1.1205 | -0.0029 (-0.26%) | 1.1403 | 1.1177 | 1.1248 |
| GBP/USD | 1.3376 | -0.0026 (-0.19%) | 1.3402 | 1.3201 | 1.32701 |
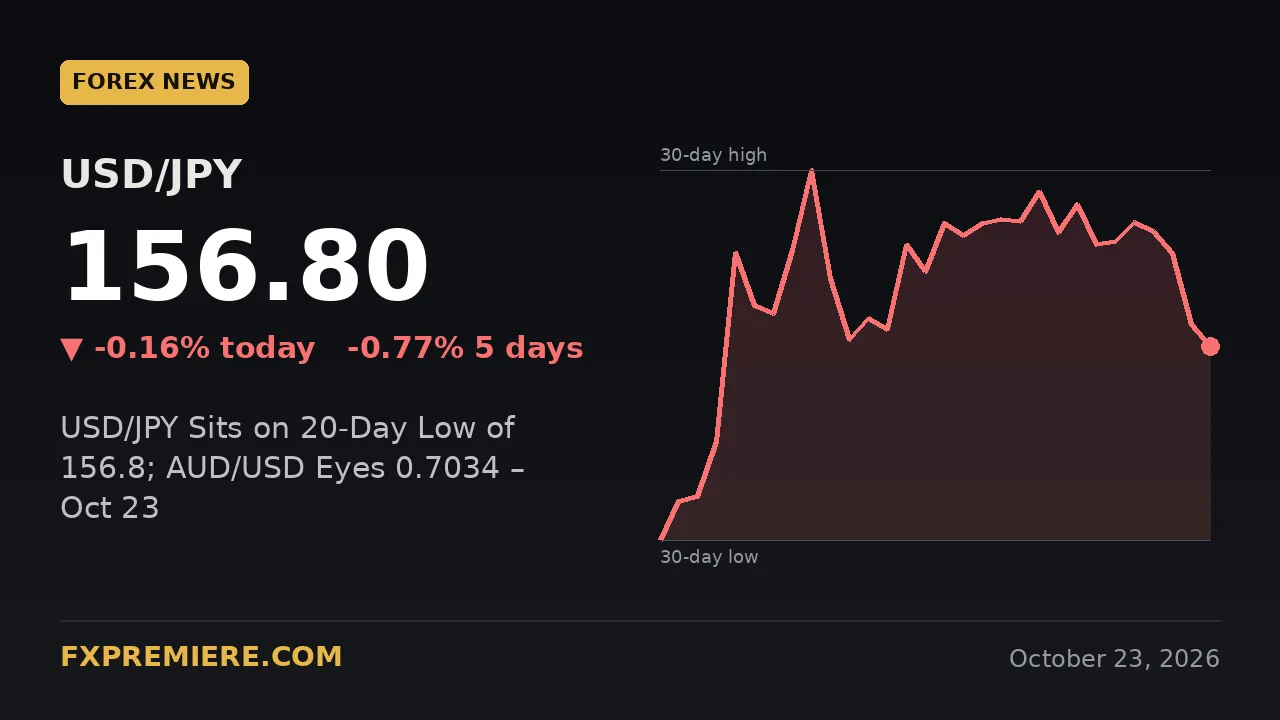
| USD/JPY | 157.05 | -0.83 (-0.53%) | 158.6 | 156.88 | 157.889 |
The 20-day highs, lows and averages come from daily data. Treat them as reference points for context rather than as guaranteed turning points.
What are the key gold levels to watch now?
The most important gold level is the 20-day low at 4,033.54, because price is sitting almost exactly on it. Gold fell $93.44 from a previous close of 4,128.04 and is down 2.9% over the week.
- 4,033.54 (20-day low): a daily close below it would mean gold has left its 20-day range on the downside. That would put the focus on whether sellers can extend the move or whether buyers step in quickly.
- 4,148.53 (20-day average): price is $113.93 below it. A recovery towards this level would show the drop is being retraced, while repeated rejections there would suggest it is acting as resistance.
- 4,211.15 (20-day high): $176.55 above the current price. Reaching it would take a sustained reversal of the whole move.
The full 20-day range is $177.61 wide, so a $93 daily move covers more than half of it. For a deeper look at what tends to move bullion, see our guide to the macroeconomic drivers of gold.
What are the key EUR/USD levels to watch?
EUR/USD is at 1.1205, just 0.0028 above its 20-day low of 1.1177, so that low is the nearest level to watch. The pair fell 0.26% today but is almost flat on the week at -0.03%.
- 1.1177 (20-day low): a daily close below would signal a new 20-day low and a more pronounced dollar-strength phase.
- 1.1248 (20-day average): 0.0043 above price. Recovering it would bring the pair back to the middle of its recent range.
- 1.1403 (20-day high): a distant level, 0.0198 away, and a reminder of how far the pair has slipped from its recent peak.
What are the key GBP/USD levels to watch?
GBP/USD at 1.3376 is trading just under its 20-day high of 1.3402, which was also the previous close. The pair is up 0.97% on the week despite today's 0.19% dip.
- 1.3402 (20-day high): 0.0026 above price. A daily close above it would extend the pair's recent run to a fresh 20-day high.
- 1.32701 (20-day average): price sits about 0.0106 above it, so sterling remains comfortably above its recent mean.
- 1.3201 (20-day low): 0.0175 below. A move that far would erase most of the past month's gains.
What are the key USD/JPY levels to watch?
USD/JPY at 157.05 is only 0.17 above its 20-day low of 156.88, after a 0.53% fall today. The pair is down 0.59% over the week.
- 156.88 (20-day low): a close below would mean the pair has moved out of its 20-day range to the downside.
- 157.889 (20-day average): about 0.84 above price. Regaining it would suggest today's drop is fading.
- 158.6 (20-day high): 1.55 above price, marking the top of the recent range.
What data could move these levels next?
Thursday's US Unemployment Claims (12:30 UTC, forecast 200K, previous 199K) has already been released, and its result is not included in the data used here. The next catalysts arrive on Friday 23 October, all times in UTC:
- 06:00 GBP Retail Sales m/m: forecast -0.1%, previous 0.5%.
- 07:15 French Flash PMIs: manufacturing forecast 50.5 (previous 50.3), services 50.7 (previous 51.4).
- 07:30 German Flash PMIs: manufacturing forecast 53.5 (previous 53.8), services 52.5 (previous 52.9).
- 08:30 UK Flash PMIs: manufacturing forecast 51.8 (previous 52.0), services 51.8 (previous 51.7).
- 13:45 US Flash PMIs: manufacturing forecast 55.4 (previous 57.0), services 57.9 (previous 58.7).
- 14:00 US UoM Consumer Sentiment: forecast 46.3, previous 46.3. Revised inflation expectations have a previous reading of 4.7%.
The European and UK releases could test GBP/USD's 1.3402 high and EUR/USD's 1.1177 low early in the session. The US PMIs could matter for gold and USD/JPY later in the day. Liquidity tends to shift around these windows, which is covered in our session optimisation guide.
How can traders use a levels map sensibly?
A levels map is a way to define scenarios in advance, not a prediction. Closing prices usually tell you more than brief spikes through a level, and wide daily ranges, like gold's $93 move today, call for careful sizing. Our articles on gold position sizing and risk management with gold signals explain how to approach that. You can follow live updates on our gold signals page.
Frequently asked questions
Where is the gold 20-day low?
The 20-day low for gold is 4,033.54, and the last price is 4,034.6, just $1.06 above it. A daily close below that level would put gold outside its 20-day range.
What is the 20-day average and why does it matter?
The 20-day average is the mean of the last 20 daily values and shows where price has typically traded over the past month. Gold is $113.93 below its average of 4,148.53, which shows how stretched today's move is relative to recent trading.
Which pair is closest to a 20-day extreme?
Gold is closest to its 20-day low (about 0.03% away), followed by USD/JPY (0.17 above 156.88). GBP/USD is 0.0026 below its 20-day high of 1.3402, and EUR/USD is 0.0028 above its 20-day low of 1.1177.
Trading involves risk, and you can lose money. The levels in this article are for educational purposes only and are not financial advice.
Risk warning: trading gold, forex, CFDs, indices and crypto involves significant risk of loss. Signals are educational information, not personal financial advice, and past results do not guarantee future performance. FXPremiere is a signal provider, not a broker.