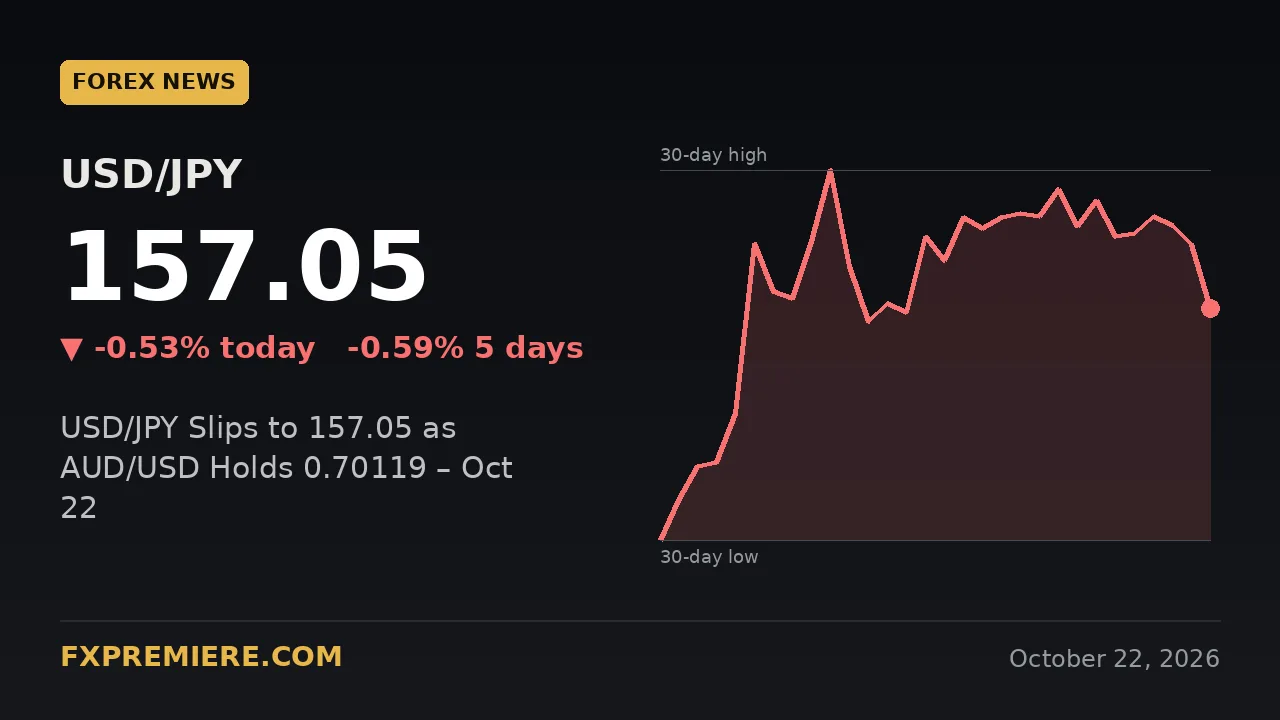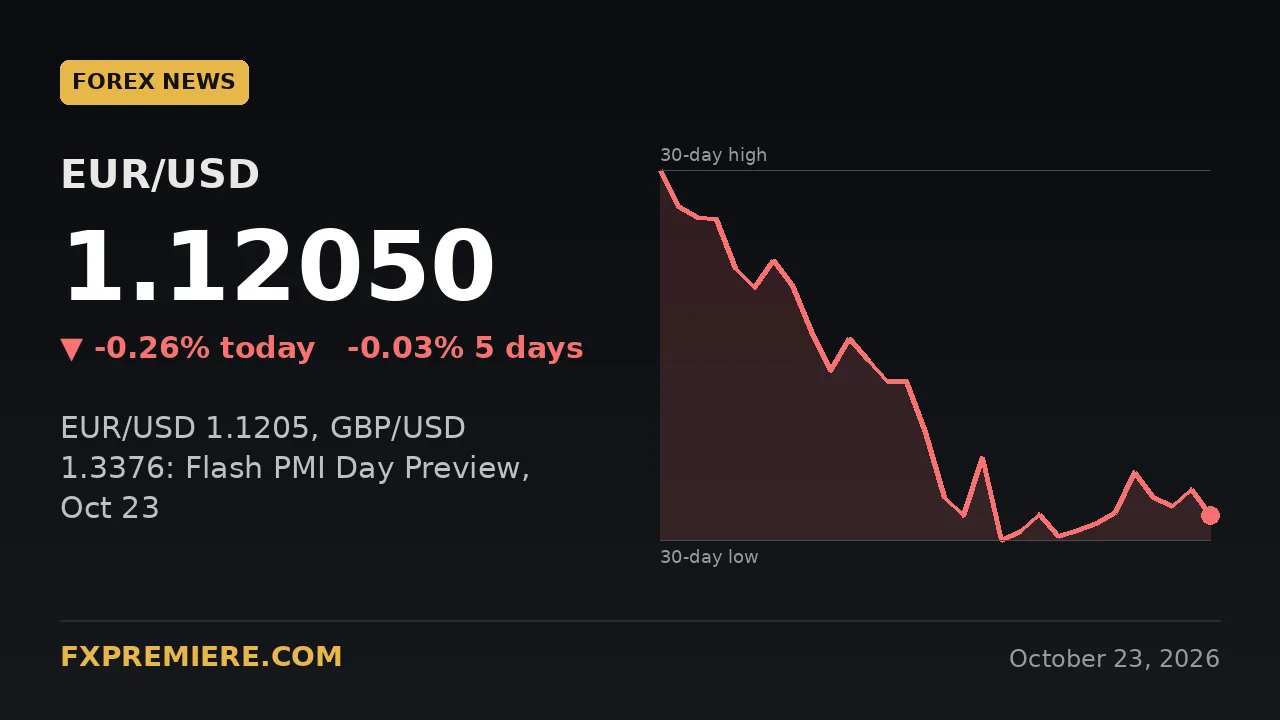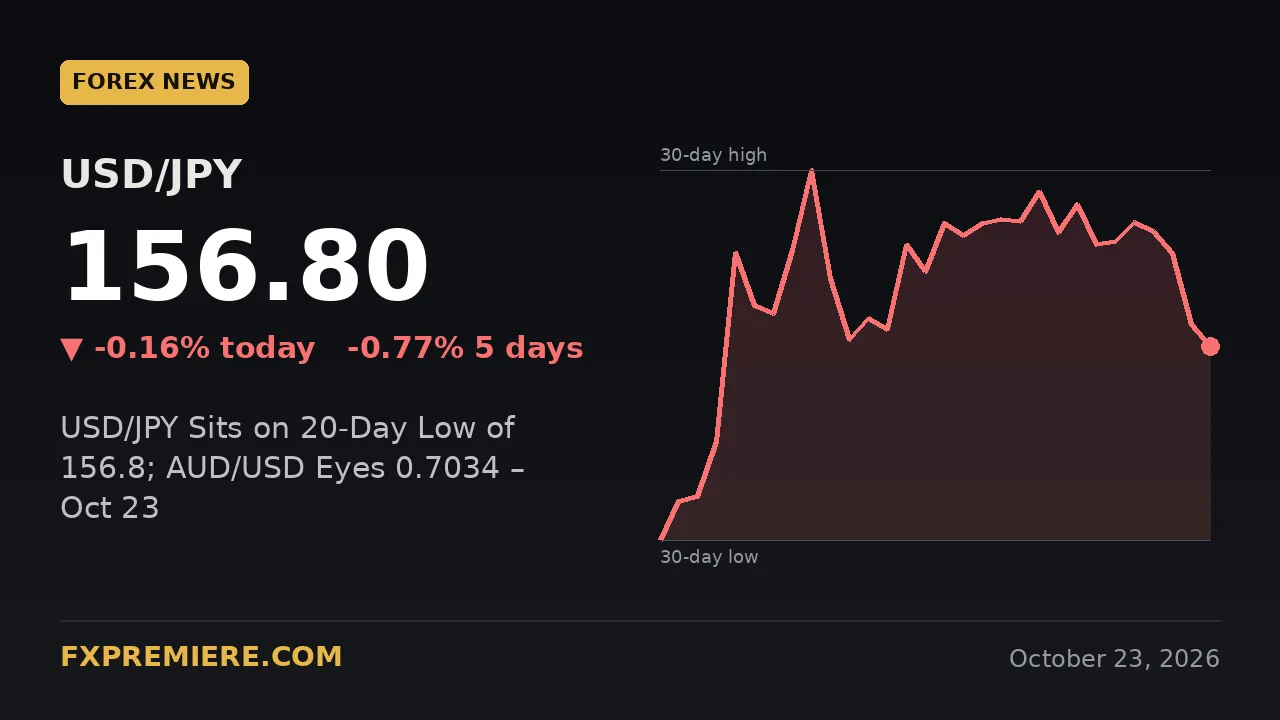
USD/JPY is trading at 156.8 this afternoon, down 0.25 (-0.16%) on the day and level with its 20-day low. AUD/USD is at 0.70224, up 0.15% and only 0.00116 below its 20-day high of 0.7034. The dollar is not moving as one block: it is softer against the yen, Canadian dollar and Australian dollar, and firmer against the Swiss franc.
Key figures
| Pair | Last | Daily change | Change % | 20-day high | 20-day low | 20-day average |
|---|---|---|---|---|---|---|
| USD/JPY | 156.8 | -0.25 | -0.16% | 158.6 | 156.8 | 157.85 |
| AUD/USD | 0.70224 | +0.00105 | +0.15% | 0.7034 | 0.69108 | 0.69787 |
| USD/CAD | 1.3995 | -0.0039 | -0.28% | 1.4262 | 1.3995 | 1.41775 |
| USD/CHF | 0.82435 | +0.00231 | +0.28% | 0.83528 | 0.82204 | 0.82963 |
These figures come from daily data, so the day high and low equal the last price. They show where each pair sits against its 20-day range, not the intraday swing.
What moved in the dollar majors today?
The dollar slipped against three of the four pairs we track, and the weekly picture is similar.
- USD/JPY: down 0.77% on the week and level with its 20-day low, 1.05 below the 20-day average of 157.85.
- AUD/USD: up 0.91% on the week, trading 0.00437 above its 20-day average of 0.69787.
- USD/CAD: down 1.17% on the week, also at its 20-day low, and 0.01825 below its 20-day average.
- USD/CHF: up 0.28% today but only 0.05% higher on the week, and still 0.00528 below its 20-day average.
The Swiss franc is the exception. USD/CHF is 0.00231 above its 20-day low of 0.82204, so it is not under the same pressure as USD/JPY and USD/CAD.
How do US yields link to USD/JPY?
USD/JPY usually follows the gap between US and Japanese interest rates, so moves in US yields often show up in the pair.
When US yields rise relative to Japan's, holding dollars becomes more attractive and the pair tends to climb. When US yields ease, the pair often slips. Our data does not include a yield reading for today, so we cannot say yields drove this move. What we can say is that a pair sitting on its 20-day low is a useful prompt to check the US yield backdrop alongside the price.
The same logic matters beyond forex. Our guide on real yields, the dollar index and gold explains how that channel affects dollar-priced markets more widely.
What are the key USD/JPY levels to watch?
The first level is 156.8, which is both the current price and the 20-day low. The pair has no recent daily low beneath it, so this is the edge of the 20-day range.
- Below 156.8: a daily close under this level would mean the pair is trading below its 20-day range, and that would shift attention to the next area of support.
- Recovery scenario: a move back toward the 20-day average of 157.85 would show the dip is fading.
- Upper boundary: the 20-day high of 158.6 is 1.8 above the current price. It is the level that would mark a full reversal of the recent slide.
The pair slipped to 157.05 at yesterday's close and has now lost another 0.25. That is a steady drift lower, not a sharp break.
What are the key AUD/USD levels to watch?
AUD/USD is testing the top of its range, with the 20-day high of 0.7034 only 0.00116 away from 0.70224.
- Above 0.7034: a daily close here would be a new 20-day high and would extend the 0.91% weekly gain.
- Pullback scenario: a slip back toward the 20-day average of 0.69787 would mean the rally is losing momentum.
- Deeper support: the 20-day low of 0.69108 is the lower edge of the range, 0.01116 below the current price.
The 0.70 handle is a round number that traders often watch. The pair has held above it, and yesterday's close of 0.70119 was already over that mark.
What was on the calendar today, and what is next?
Today's scheduled data has now been released, and the calendar shows nothing further of high or medium impact. Our feed has no actual readings, so check the released figures against the forecasts below before drawing conclusions.
US data (already out)
- 13:45 UTC, US Flash Manufacturing PMI: forecast 55.4, previous 57.0.
- 13:45 UTC, US Flash Services PMI: forecast 57.9, previous 58.7.
- 14:00 UTC, Revised UoM Consumer Sentiment: forecast 46.3, previous 46.3.
- 14:00 UTC, Revised UoM Inflation Expectations: previous 4.7%, no forecast given.
Earlier in the day
- 06:00 UTC, UK Retail Sales m/m: forecast -0.1%, previous 0.5%.
- 07:15 and 07:30 UTC, French and German flash PMIs: for example, German manufacturing forecast 53.5 against 53.8 previously.
- 08:30 UTC, UK flash PMIs: manufacturing forecast 51.8 (previous 52.0), services forecast 51.8 (previous 51.7).
The forecasts for the US PMIs were lower than the previous readings. A print that came in above those forecasts would tend to support the dollar, while a miss would tend to weigh on it. With no further scheduled events, price action into the weekly close may be driven more by position squaring than by new data.
If you trade around release times, our guide to the London open and New York crossover covers how liquidity changes across sessions. You can also follow other live forex news updates for the latest moves.
Frequently asked questions
Why is USD/JPY down today?
USD/JPY is at 156.8, down 0.25 (-0.16%) from yesterday's 157.05, and it is level with its 20-day low. Our data does not show a specific cause, so the fall is best read as a continuation of the 0.77% weekly decline.
Is AUD/USD close to a breakout?
AUD/USD is at 0.70224, which is 0.00116 below its 20-day high of 0.7034. A daily close above 0.7034 would be a new 20-day high, but a close above a level does not guarantee that the move will continue.
Does the dollar's move affect gold?
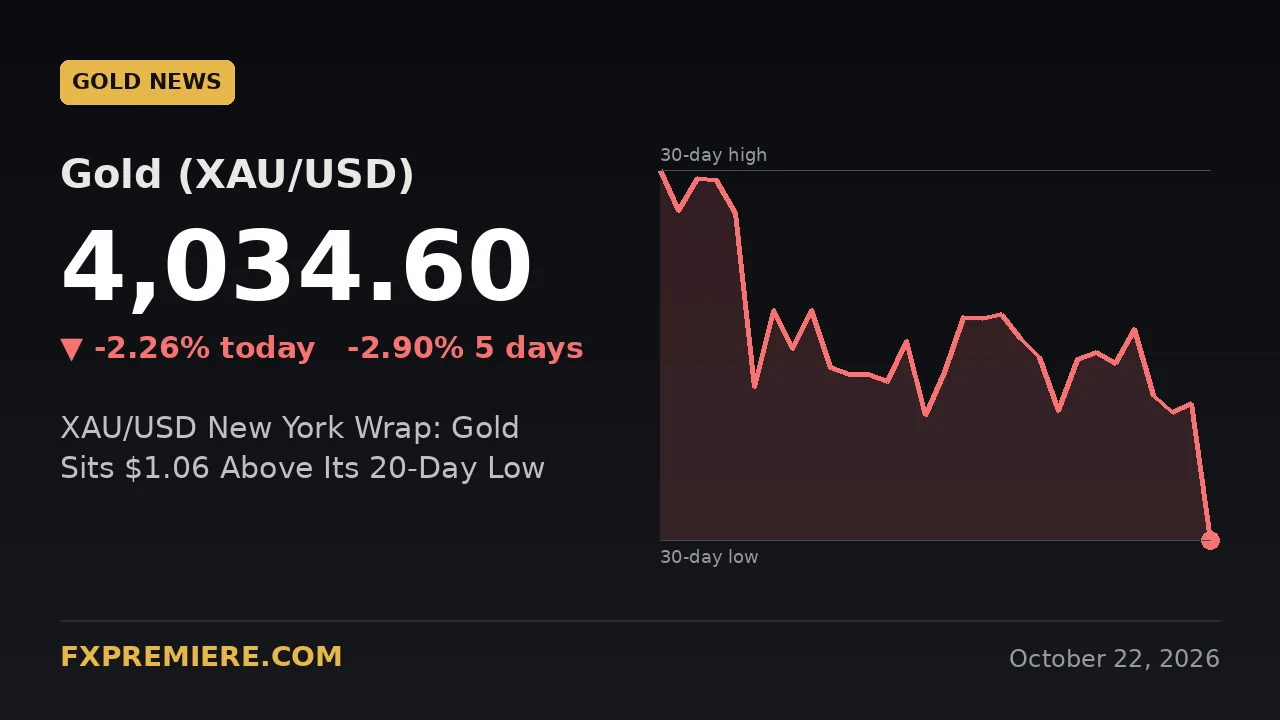
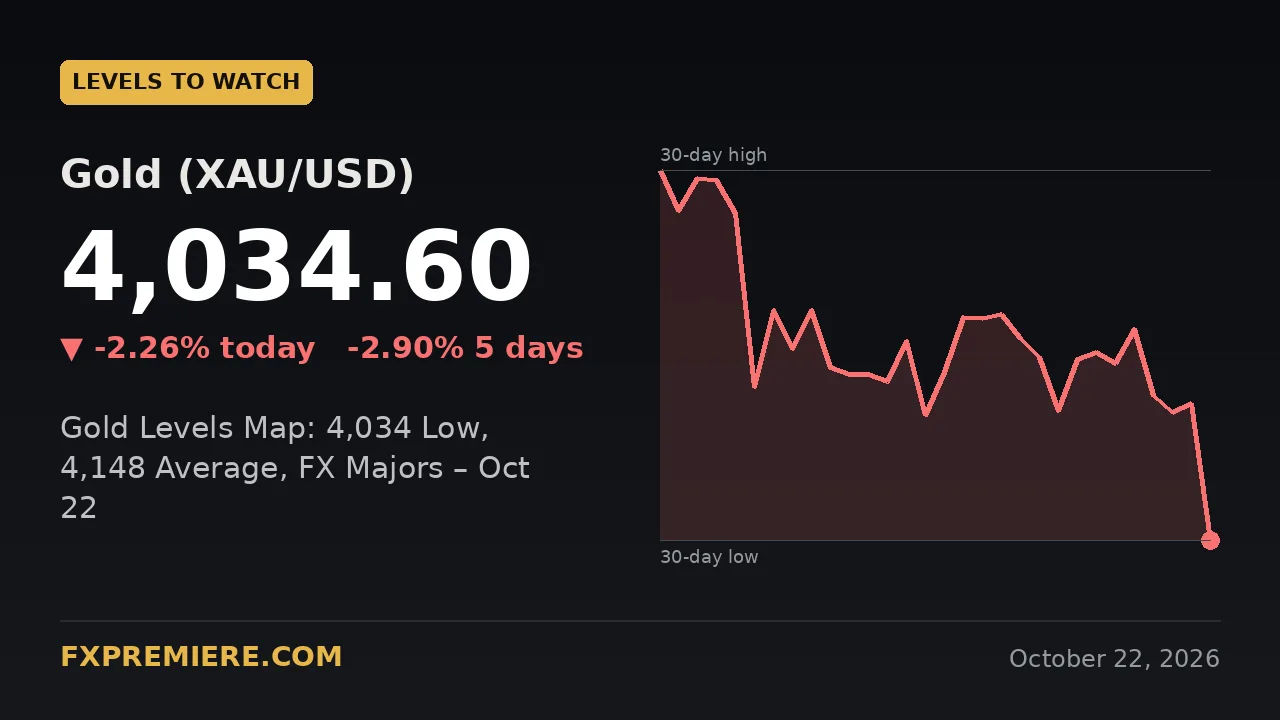
Gold is priced in dollars, so a weaker dollar can be supportive and a firmer one a headwind, though gold also responds to yields and other factors. Our gold signals page covers how we approach XAU/USD.
Trading involves risk, and you can lose more than you expect. The levels in this article are for education, not advice. A guide to risk management when using trading signals is a useful place to start before you trade.
Risk warning: trading gold, forex, CFDs, indices and crypto involves significant risk of loss. Signals are educational information, not personal financial advice, and past results do not guarantee future performance. FXPremiere is a signal provider, not a broker.