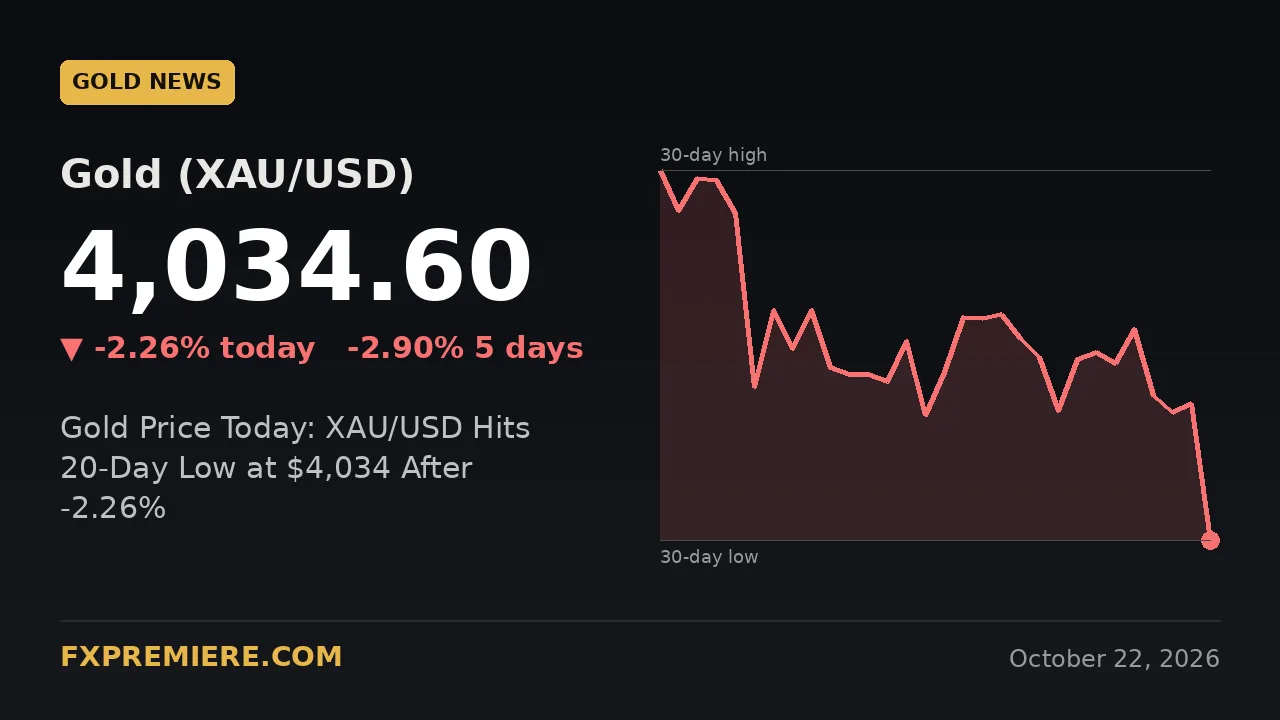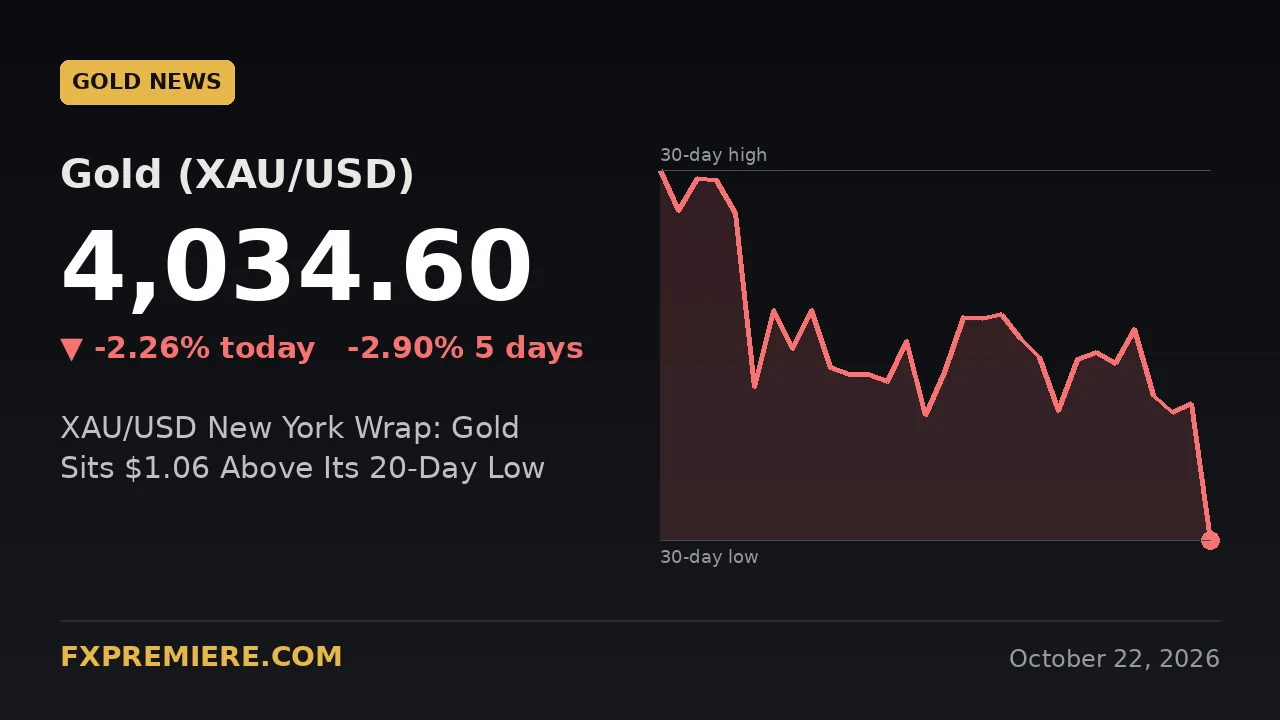
Gold is trading at $4,034.60 late in the New York session on Thursday 22 October, down $93.44 or 2.26% from the previous close of $4,128.04. That leaves XAU/USD just $1.06 above the 20-day low of $4,033.54, which is also today's low.
The metal has fallen 2.9% over the past week and sits $113.93 below its 20-day average. The next question is whether the 20-day low holds or gives way.
Key figures
| Instrument | Last | Daily change | Change % | 20-day high | 20-day low | 20-day average |
|---|---|---|---|---|---|---|
| Gold (XAU/USD) | 4034.6 | -93.44 | -2.26% | 4211.15 | 4033.54 | 4148.53 |
Today's high was $4,128.8, barely above the previous close. Today's low was $4,033.54. The weekly change is -2.9%.
Why is gold falling today?
Gold is down because sellers dominated the whole session. The price opened the day near the $4,128.04 prior close, touched $4,128.8, and has since slid to within about a dollar of the day's low.
The data we have does not identify a single cause, so it would be wrong to point to one. What the price action does show:
- A one-way move: the daily range runs from $4,033.54 to $4,128.8, roughly $95, and price is at the bottom of it.
- No recovery so far: the current price is only $1.06 off the low, so buyers have not yet produced a meaningful bounce.
- A bigger than usual daily drop: -2.26% is a large move for gold, and it follows a -2.9% weekly decline.
Moves of this size often come from a mix of dollar, yield and positioning shifts. For a framework on how these drivers interact, see our guide to the macroeconomic drivers of gold.
Where is gold within its 20-day range?
Gold is at the very bottom of its 20-day range. That range spans $4,033.54 to $4,211.15, a width of $177.61, and the current price is less than 1% of that width above the floor.
- Versus the high: $176.55 below the 20-day high of $4,211.15.
- Versus the average: $113.93 below the 20-day average of $4,148.53.
- Versus the prior close: $93.44 below $4,128.04.
A price pinned to the low of its range is a place where traders pay close attention. A break of the low opens room for a fresh 20-day extreme, while a hold can turn the level into short-term support. Neither outcome is certain.
What are the key XAU/USD levels to watch?
The first level is the $4,033.54 low, which is both today's and the 20-day low. Everything above it is resistance.
- $4,033.54: a sustained move below this level would put gold at its lowest in 20 days and could invite further selling. A quick rejection and recovery would suggest buyers are defending it.
- $4,128.04: the previous close. Today's high of $4,128.8 stalled right here, so it is the first reference for any rebound.
- $4,148.53: the 20-day average. A daily close back above it would signal the pullback is easing.
- $4,211.15: the 20-day high, the upper edge of the recent range.
A weak, slow bounce that fails near $4,128 would keep the bearish tone intact. A sharp reversal on heavy volume would argue the drop was overdone. For traders who work around these hours, our piece on the London open and New York crossover explains why liquidity changes matter near session ends.
What about silver, the dollar and yields?
The data supplied for this update covers gold only, so we cannot quote silver, dollar or yield levels today. Check those yourself before drawing conclusions.
Here is what to look for:
- The dollar: gold is priced in dollars, so a firmer dollar tends to weigh on it and a softer one tends to help.
- Treasury yields: higher real yields raise the opportunity cost of holding a non-yielding asset.
- Silver: it often moves in the same direction as gold but with larger swings. If silver is falling faster, the move may be broad metals selling. If it is holding up, gold's drop may be more specific to gold.
If all three line up against gold, the move has broader support. If they are mixed, the drop may be more about positioning. Our overview of macro catalysts driving XAU/USD covers how to weigh these inputs.
Which US events can move gold next?
The next scheduled US releases come on Friday, so the rest of Thursday's New York session has no major scheduled data. US Unemployment Claims were due at 12:30 UTC today with a forecast of 200K against 199K previously. The actual figure is not in our data, so we make no claim about the result.
Upcoming US events (all times UTC):
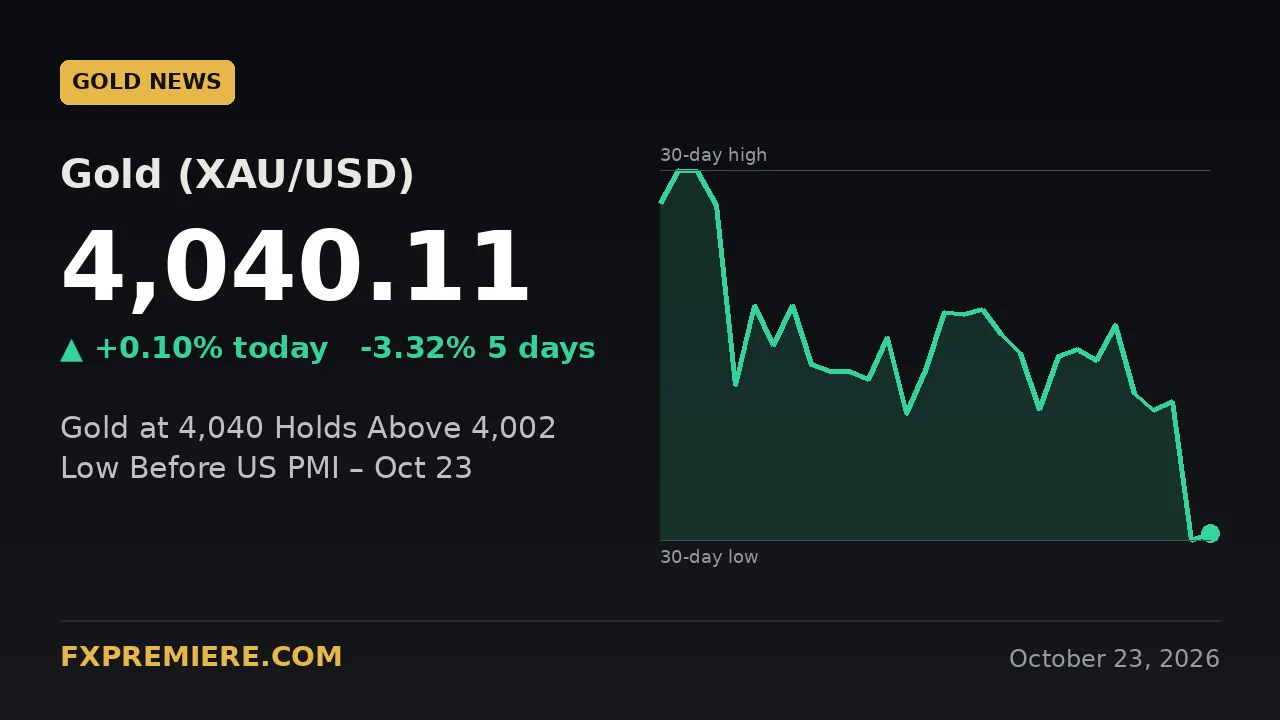
- Fri 23 Oct, 13:45: US Flash Manufacturing PMI, forecast 55.4, previous 57.0.
- Fri 23 Oct, 13:45: US Flash Services PMI, forecast 57.9, previous 58.7.
- Fri 23 Oct, 14:00: Revised UoM Consumer Sentiment, forecast 46.3, previous 46.3.
- Fri 23 Oct, 14:00: Revised UoM Inflation Expectations, previous 4.7% (no forecast given).
Both PMIs are forecast to ease from the prior readings. Inflation expectations are worth watching because they can shift views on rates, and rate views tend to feed into gold through the dollar and yields.
Earlier on Friday, European and UK data arrives first:
- 06:00: UK Retail Sales m/m, forecast -0.1%, previous 0.5%.
- 07:15: French Flash Manufacturing PMI, forecast 50.5, previous 50.3, and Services PMI, forecast 50.7, previous 51.4.
- 07:30: German Flash Manufacturing PMI, forecast 53.5, previous 53.8, and Services PMI, forecast 52.5, previous 52.9.
- 08:30: UK Flash Manufacturing PMI, forecast 51.8, previous 52.0, and Services PMI, forecast 51.8, previous 51.7.
These can move the euro and sterling, which in turn can move the dollar and gold. The Asian and London sessions will also react to wherever New York leaves gold tonight.
For live updates through the day, follow our live gold signals and news page.
How can traders manage risk when gold is at a range low?
Sizing positions to the range is the most practical step. With a 20-day range of $177.61 and a single day already moving $93.44, stops and size need to reflect that volatility. Our guide to gold position sizing shows how to scale exposure to the distance of a stop, and the 1% to 2% rule gives a simple cap on risk per trade.
Frequently asked questions
What is the gold price today?
At the time of writing, XAU/USD is at $4,034.60, down $93.44 or 2.26% from the previous close of $4,128.04. The day's range is $4,033.54 to $4,128.8.
Is gold at a 20-day low?
Effectively yes. The 20-day low is $4,033.54, set today, and the current price is $1.06 above it. The 20-day high is $4,211.15 and the 20-day average is $4,148.53.
What could move gold next?
Friday brings US flash PMIs at 13:45 UTC and revised University of Michigan sentiment and inflation expectations at 14:00 UTC. European and UK PMIs and UK retail sales earlier in the day could also affect the dollar and, through it, gold.
Trading involves risk and you can lose more than you expect. The levels and scenarios here are for education, not personal advice, and nothing in this article is a recommendation to buy or sell.
Risk warning: trading gold, forex, CFDs, indices and crypto involves significant risk of loss. Signals are educational information, not personal financial advice, and past results do not guarantee future performance. FXPremiere is a signal provider, not a broker.