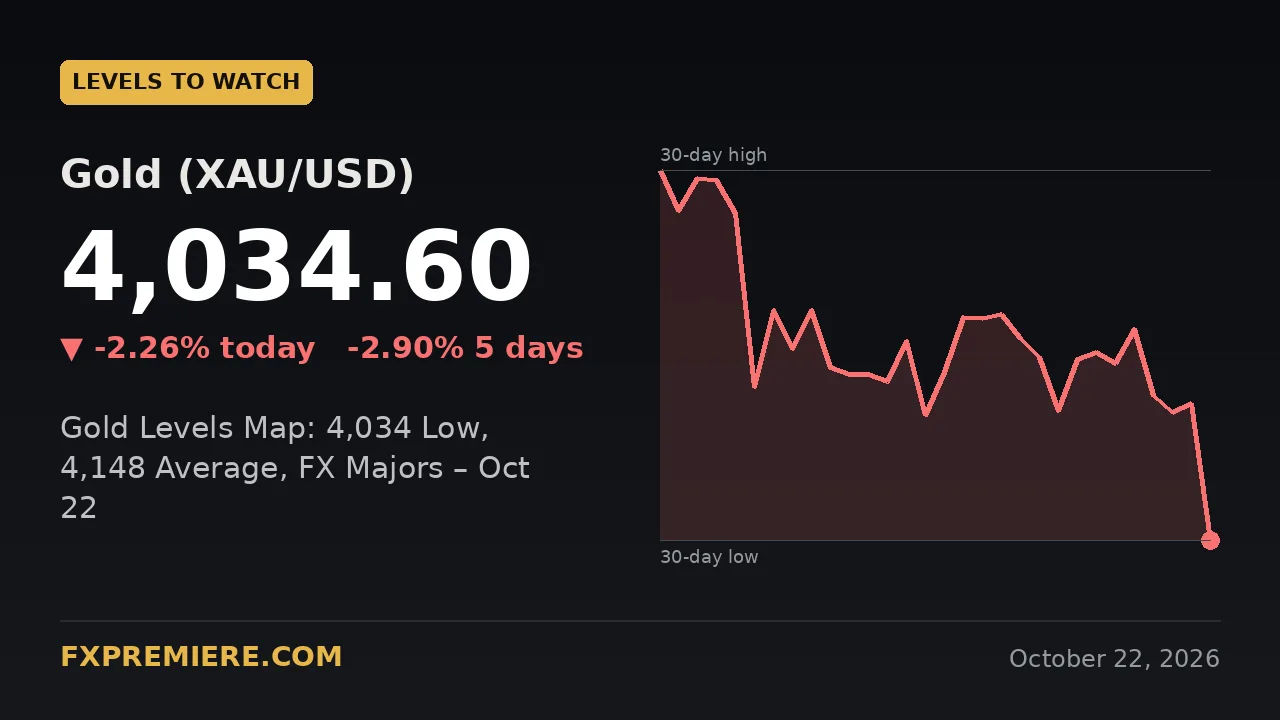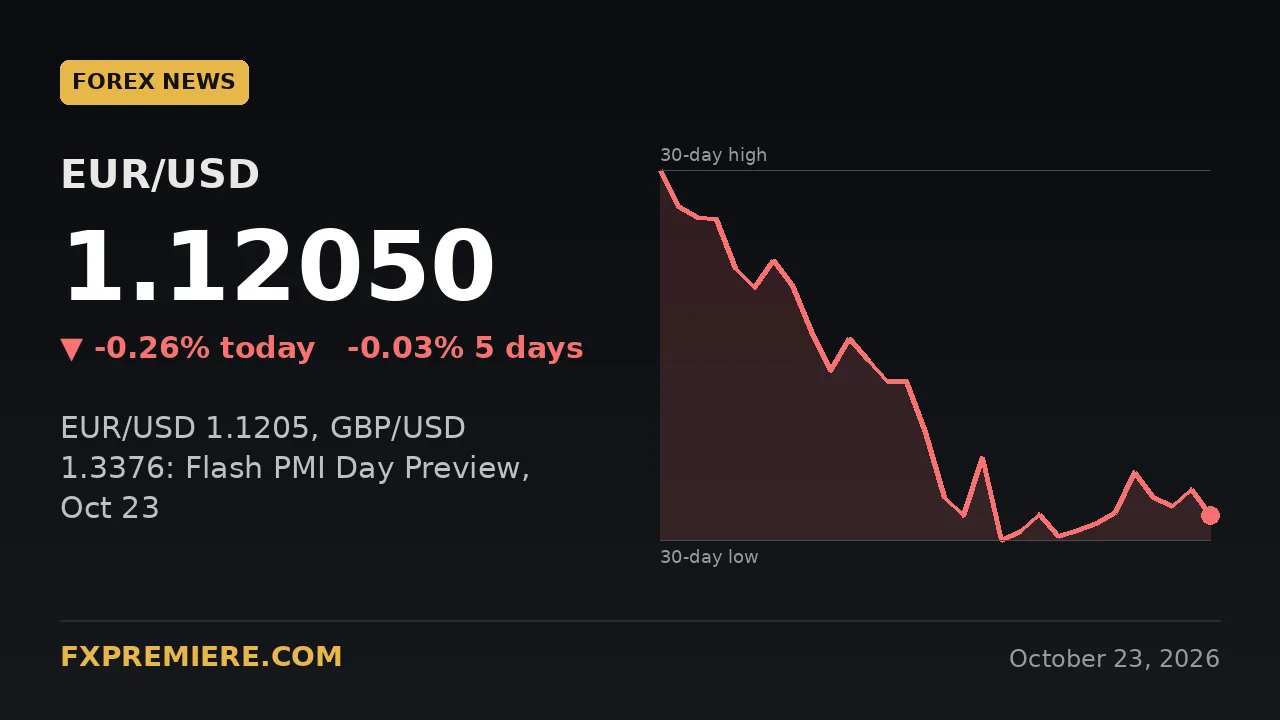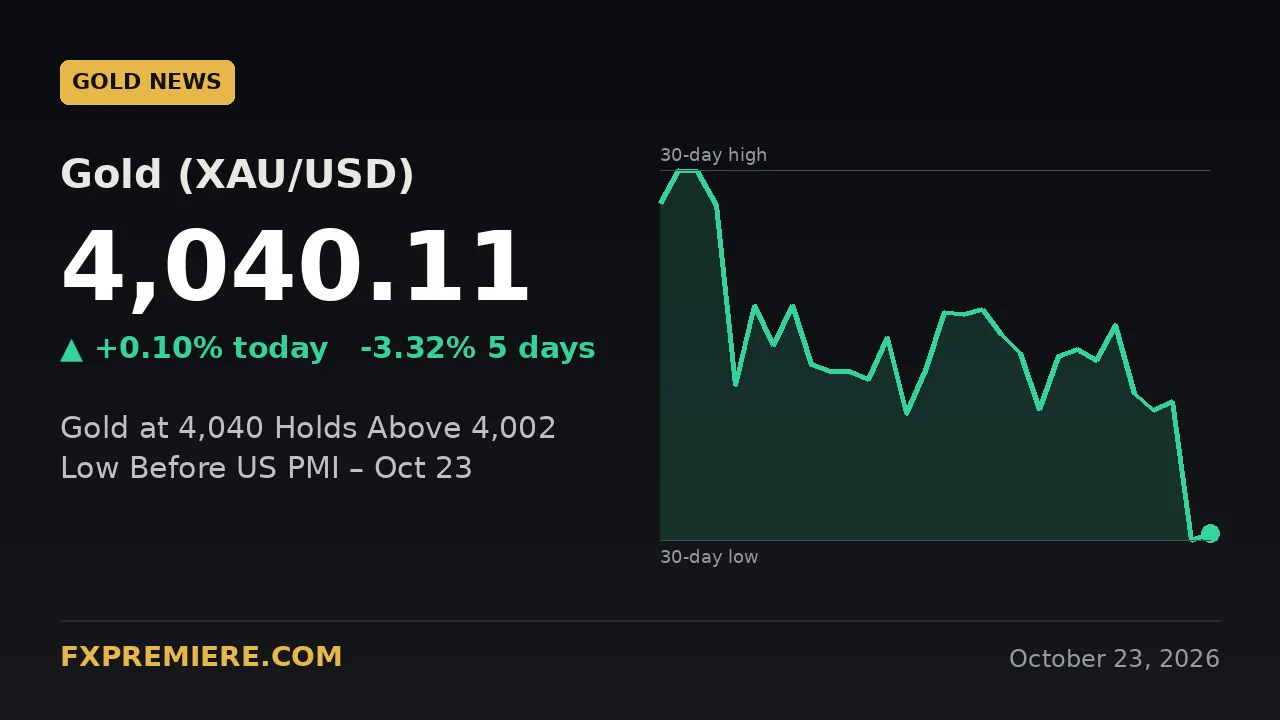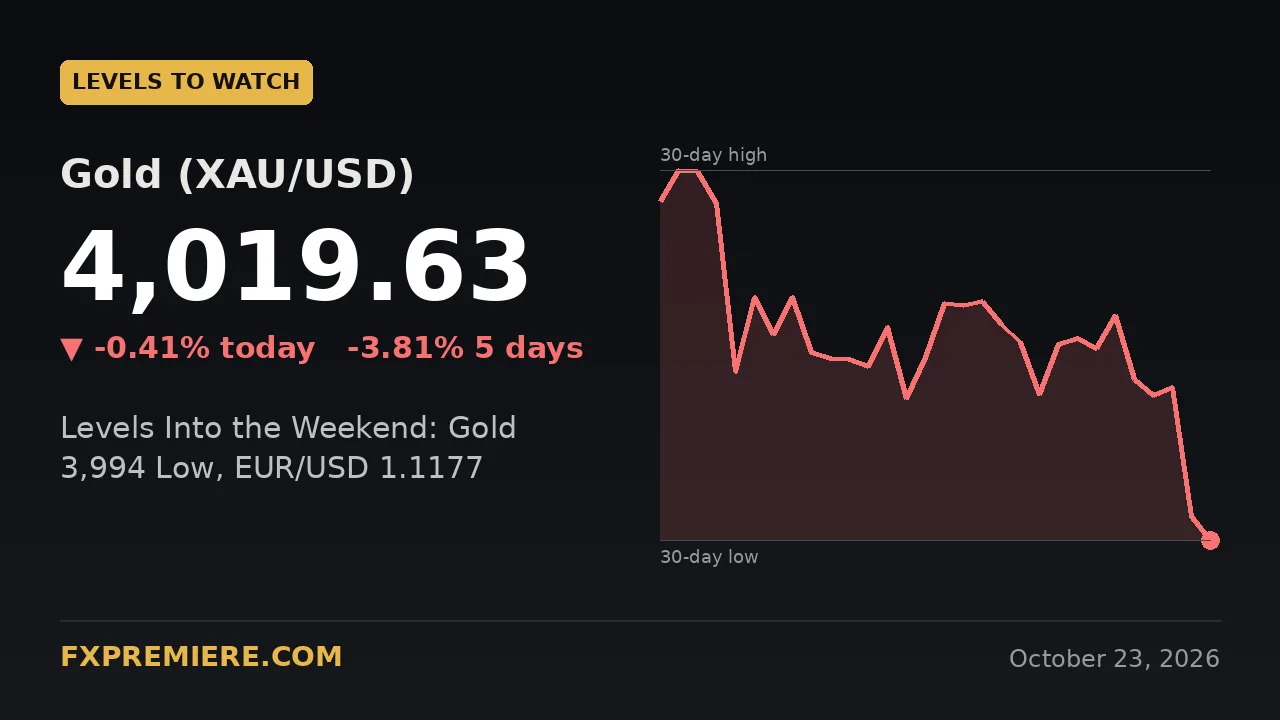
Gold is trading at 4,019.63 on Friday afternoon, just 25.63 above its 20-day low of 3,994.00, which was set today. Among the majors, EUR/USD (1.1193) is close to its own 20-day low of 1.1177, and USD/JPY (156.8) is level with its 20-day low. The levels below show where each market stands against its recent range as the week winds down.
Key figures
| Instrument | Last | Daily change | 20-day high | 20-day low | 20-day average |
|---|---|---|---|---|---|
| Gold (XAU/USD) | 4,019.63 | -16.47 (-0.41%) | 4,211.15 | 3,994.00 | 4,142.18 |
| EUR/USD | 1.1193 | -0.0012 (-0.11%) | 1.1378 | 1.1177 | 1.12375 |
| GBP/USD | 1.3368 | -0.0008 (-0.06%) | 1.3402 | 1.3201 | 1.3276 |
| USD/JPY | 156.8 | -0.25 (-0.16%) | 158.6 | 156.8 | 157.85 |
The FX figures here are daily reference values, so we use the 20-day range rather than intraday highs and lows for those pairs.
Where is gold trading and which levels matter now?
Gold is at 4,019.63, down 0.41% on the day and 3.81% on the week, and it sits in the lower part of its 20-day range. The session high so far is 4,046.08 and the low is 3,994.00. That low is also the 20-day low, so the market has just printed a fresh low for the window.
- 3,994.00 (20-day low and today's low): A daily close below it would extend the downtrend and leave no recent reference below. A move back above it that holds would suggest today's low was rejected.
- 4,046.08 (today's high): This is the nearest intraday resistance. Sustained trade above it would mean the day's selling has faded.
- 4,142.18 (20-day average): Price is 122.55 below it. A recovery to this area would show buyers regaining the middle of the recent range, and a rejection there would keep the pattern of lower highs intact.
- 4,211.15 (20-day high): A close above it would reverse the recent slide. That looks distant, since it is 191.52 above the current price.
Gold converted to euros is 3,591.2, which gives a rough sense of the move for euro-based readers. For the wider drivers behind gold moves, see our guide to the macroeconomic drivers of gold.
What are the key EUR/USD levels to watch?
The level to watch is the 20-day low of 1.1177, only 0.0016 below the current 1.1193. EUR/USD is down 0.11% on the day and 0.53% on the week.
- 1.1177: A daily close below it would put the pair at a new low for the window and open the way to further downside. Holding above it would keep the pair in its recent range.
- 1.12375 (20-day average): Price is 0.00445 below it. A move back above would suggest the dip is losing momentum.
- 1.1378 (20-day high): This is the upper edge of the range. It is a long way off and would need a broad shift in dollar sentiment.
What do the GBP/USD levels say?
GBP/USD is the firmest of the group at 1.3368, up 0.25% on the week, and it sits near the top of its range. The 20-day high is 1.3402, only 0.0034 away, while the low is 1.3201 and the average is 1.3276.
- 1.3402: A close above it would be a fresh 20-day high and a sign of continued sterling strength against the dollar.
- 1.3276: The average is 0.0092 below the current price. A pullback to it would be a normal retracement within the range, and a close below would weaken the firm picture.
- 1.3201: Only a break below this low would reverse the recent pattern.
Is USD/JPY at a key support level?
Yes. At 156.8, USD/JPY is exactly on its 20-day low, down 0.16% on the day and 0.77% on the week. A daily close below 156.8 would be a new low for the window and a clear shift in direction.
- 156.8: Holding here would make it a short-term floor. A break would mean there is no recent reference level below.
- 157.85 (20-day average): This is 1.05 above the current price. A recovery to it would show the slide pausing.
- 158.6 (20-day high): A close above it would reverse the recent trend, though it is 1.8 away.
What data came out today, and what comes next?
The scheduled releases for today are now behind us. Our calendar data does not include the actual figures, so check the results against the forecasts below before drawing conclusions from them.
- 06:00 UTC, GBP Retail Sales m/m: forecast -0.1%, previous 0.5%.
- 07:15 UTC, French flash PMIs: manufacturing forecast 50.5 (previous 50.3); services forecast 50.7 (previous 51.4).
- 07:30 UTC, German flash PMIs: manufacturing forecast 53.5 (previous 53.8); services forecast 52.5 (previous 52.9).
- 08:30 UTC, UK flash PMIs: manufacturing forecast 51.8 (previous 52.0); services forecast 51.8 (previous 51.7).
- 13:45 UTC, US flash PMIs: manufacturing forecast 55.4 (previous 57.0); services forecast 57.9 (previous 58.7).
- 14:00 UTC, UoM consumer sentiment (revised): forecast 46.3, previous 46.3.
- 14:00 UTC, UoM inflation expectations (revised): previous 4.7%.
With the main data out, the focus shifts to whether the levels above hold into the weekly close. Liquidity usually thins late on Friday, and prices can move quickly to a level and back. Many traders review their levels and risk before the weekend rather than chase a late move. Our piece on how to read XAUUSD signals covers that kind of check, and live gold ideas are available on the gold signals page.
Frequently asked questions
What is the 20-day average and why does it matter?
The 20-day average is the mean of the last 20 daily values. It marks the centre of the recent range, so a price far below it, as gold is now (122.55 below 4,142.18), shows how stretched a move has become. Traders often watch it as a first area where a bounce might stall.
What does a break of the 20-day low mean?
A close below the 20-day low means the market has gone beyond its recent range, which often points to continued momentum. It is not a guarantee, because breaks can fail and reverse quickly. Many traders wait for a daily close rather than react to a brief intraday dip.
Which of these markets is closest to a key level right now?
USD/JPY is exactly on its 20-day low of 156.8. EUR/USD is 0.0016 above its low of 1.1177, and gold is 25.63 above its low of 3,994.00. GBP/USD is the exception, sitting 0.0034 below its 20-day high.
Trading involves risk, and you can lose more than you expect. The levels in this article are for education and are not advice to buy or sell. To keep losses small, see our guide to risk management when using gold trading signals.
Risk warning: trading gold, forex, CFDs, indices and crypto involves significant risk of loss. Signals are educational information, not personal financial advice, and past results do not guarantee future performance. FXPremiere is a signal provider, not a broker.