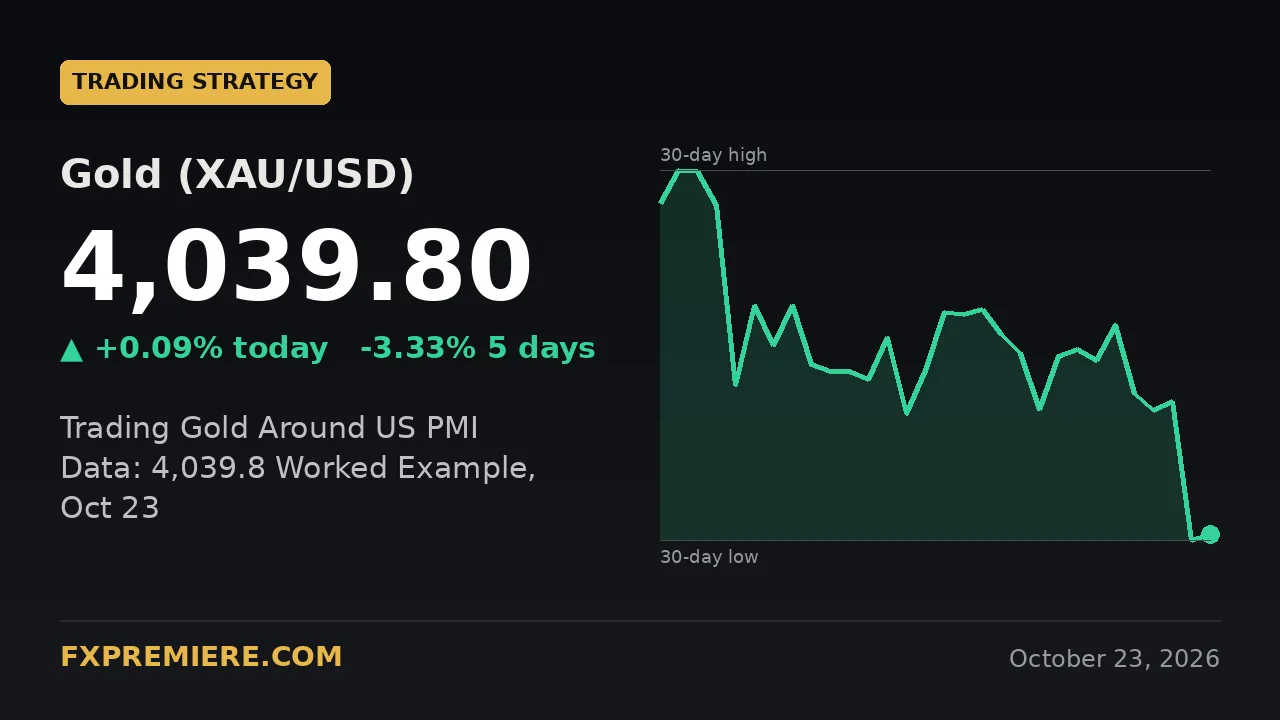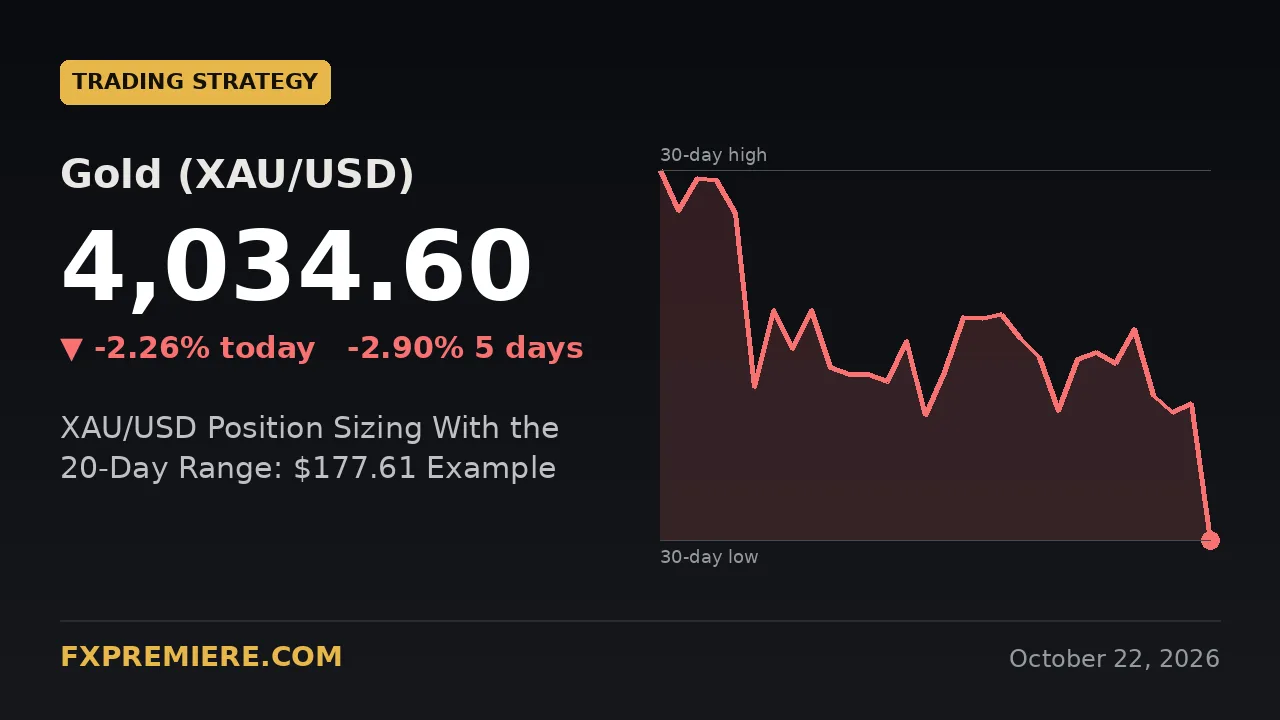
The 20-day range is a simple way to turn a price chart into a risk number. Gold's range is $177.61 (from 4,033.54 to 4,211.15) and EUR/USD's is 226 pips (from 1.1177 to 1.1403), so a stop of a quarter of that range is about $44.40 on gold and 56.5 pips on EUR/USD. This article works through both examples step by step, using the 1% risk rule.
Key figures
| Instrument | Last | Daily change | 20-day high | 20-day low | 20-day average |
|---|---|---|---|---|---|
| Gold (XAU/USD) | 4,034.6 | -93.44 (-2.26%) | 4,211.15 | 4,033.54 | 4,148.53 |
| EUR/USD | 1.1205 | -0.0029 (-0.26%) | 1.1403 | 1.1177 | 1.1248 |
What is the 20-day range and why use it for risk?
The 20-day range is the distance between the highest and lowest prices of the last 20 trading days, and it shows how far an instrument has actually been moving.
That matters because a stop that is smaller than normal price movement is likely to be hit by noise. A stop that is far too large makes the position tiny or the loss painful. The range gives you a reality check based on recent behaviour rather than guesswork.
Gold's range works out at 4,211.15 minus 4,033.54, or $177.61. EUR/USD's is 1.1403 minus 1.1177, or 0.0226, which is 226 pips.
Where do gold and EUR/USD sit in their ranges today?
Gold is at the very bottom of its range, while EUR/USD is in the lower part of its own.
- Gold: at 4,034.6 it is just $1.06 above the 20-day low of 4,033.54, roughly 0.6% of the way up the range. It is also $113.93 below the 20-day average of 4,148.53, after a fall of 2.26% on the day and 2.9% over the week.
- EUR/USD: at 1.1205 it is 28 pips above the 20-day low of 1.1177, about 12% of the way up the range, and 43 pips below the 20-day average of 1.1248.
Being at an extreme does not tell you what happens next. A fresh low can be followed by a rebound or by further selling. What it does tell you is that the nearest reference point for a stop is very close, and that crowded stop orders often sit around such levels.
How do you size a position from the range?
You size a position by deciding how much you are willing to lose first, then dividing that by the stop distance.
- Set the risk amount. Many traders use 1% to 2% of the account. For illustration, take a hypothetical $10,000 account and 1%, which is $100. Our guide to the 1% to 2% rule with XAU/USD signals covers this in more depth.
- Choose a stop distance from the range. A quarter of the range is one common yardstick. Gold: 177.61 divided by 4 is about $44.40. EUR/USD: 226 pips divided by 4 is 56.5 pips.
- Convert to size. Divide the risk amount by the loss per unit at that stop.
Gold worked example
Contract sizes vary between brokers, so check yours. If 1.00 lot is 100 ounces, a $1 move is worth $100 per lot. A $44.40 stop would lose $4,440 on one lot. To risk $100, the size is 100 divided by 4,440, or about 0.02 lots.
EUR/USD worked example
On a standard lot a pip is worth roughly $10. A 56.5-pip stop costs about $565 per lot. To risk $100, the size is 100 divided by 565, or about 0.17 lots.
Notice how the stop distance drives the result. If a gold stop were placed at today's high of 4,128.8, which is $94.20 above the 4,034.6 last price, the same $100 risk would allow only about 0.01 lots. Wider stops mean smaller positions, not bigger risk. For more on volatile bullion, see mathematical position sizing models for gold.
Where should a stop go relative to recent highs and lows?
A stop is usually better placed just beyond a level that would invalidate your idea than at an arbitrary distance.
The 20-day low and high are obvious candidates. A trade that relies on gold holding the 4,033.54 low would need a stop with some room below it, because that area is where many other traders' stops sit. EUR/USD has only 28 pips of room to its low at 1.1177, so a stop right on that level would be tight and would have to be balanced against position size.
The range check works in both directions. If the technical stop you want is far wider than a quarter of the range, either reduce the size or skip the trade. If it is far tighter, ask whether ordinary movement could trigger it. Reading how to read XAUUSD signals before placing a trade helps you compare a signal's stop with your own range-based check.
What events could move prices next?
The next cluster of high and medium-impact releases arrives on Friday 23 October, mostly European and US flash PMIs. Wide stops matter more when scheduled data can add sudden volatility.
- 06:00 UTC, GBP Retail Sales m/m: forecast -0.1%, previous 0.5%.
- 07:15 UTC, French Flash PMIs: manufacturing forecast 50.5 (previous 50.3); services forecast 50.7 (previous 51.4).
- 07:30 UTC, German Flash PMIs: manufacturing forecast 53.5 (previous 53.8); services forecast 52.5 (previous 52.9).
- 08:30 UTC, UK Flash PMIs: manufacturing forecast 51.8 (previous 52.0); services forecast 51.8 (previous 51.7).
- 13:45 UTC, US Flash PMIs: manufacturing forecast 55.4 (previous 57.0); services forecast 57.9 (previous 58.7).
- 14:00 UTC, UoM Consumer Sentiment (revised): forecast 46.3, previous 46.3. Inflation expectations previous 4.7%.
For EUR/USD, the European PMIs and the US PMIs both matter. For gold, the US releases are the more relevant, because they can shift expectations for the dollar and yields. Many traders avoid sizing up just before these times. Our piece on trading the London open and New York crossover looks at how liquidity changes around these hours.
Frequently asked questions
Why use a quarter of the 20-day range for a stop?
It is a rule of thumb, not a law. It scales your stop to recent volatility, so it is wider when markets are moving a lot and narrower when they are quiet. Some traders prefer a fifth or a third, and the key is to apply it consistently.
Does the 20-day range change?
Yes. It rolls forward each day, so a new low below 4,033.54 on gold would widen the range, and older extremes eventually drop out of the window. Recalculate your stop distance and position size whenever the range changes.
Is 1% risk per trade the right amount?
There is no single correct figure. Many traders use between 1% and 2%, and some use less when volatility is high or when several trades are open at once. The best level depends on your account size, experience and tolerance for losing streaks. You can browse more guides in our forex signals strategies section.
Trading involves risk, and you can lose more than you expect. The levels, ranges and position sizes above are for education only and are not financial advice. The account size and contract values are illustrative.
Risk warning: trading gold, forex, CFDs, indices and crypto involves significant risk of loss. Signals are educational information, not personal financial advice, and past results do not guarantee future performance. FXPremiere is a signal provider, not a broker.